Download PDF Version at http://www.wekoenig.de/KoenigDissertation2010.pdf
![]() Design and evaluation of
novel input devices and
Design and evaluation of
novel input devices and
interaction techniques for large, high-resolution displays
Dissertation
zur Erlangung des akademischen Grades des
Doktor der Naturwissenschaften (Dr.rer.nat.)
an der Universität Konstanz, Fach Informatik,
Fachbereich Informatik und Informationswissenschaft,
Mathematisch-Naturwissenschaftliche Sektion
vorgelegt von
Werner A. König
Tag der mündlichen Prüfung: 16. September 2010
Referenten:
Prof. Dr. Harald Reiterer
Prof. Dr. Oliver Deussen
Vorsitzender der Prüfungskommission:
Prof. Dr. Marc Scholl
Abstract
Large, high-resolution displays (LHRD) provide the advantageous capability of being able to visualize a large amount of very detailed information, but also introduce new challenges for human-computer interaction. Limited human visual acuity and field of view force users to physically move around in front of these displays either to perceive object details or to obtain an overview. Conventional input devices such as mouse and keyboard, however, restrict users' mobility by requiring a stable surface on which to operate and thus impede fluid interaction and collaborative work settings.
In order to support the investigation of alternative input devices or the design of new ones, we present a design space classification which enables the methodical exploration and evaluation of input devices in general. Based on this theoretical groundwork we introduce the Laser Pointer Interaction, which is especially designed to satisfy the demands of users interacting with LHRDs with respect to mobility, accuracy, interaction speed, and scalability. In contrast to the indirect input mode of the mouse, our interactive laser pointer supports a more natural pointing behaviour based on absolute pointing. We describe the iteratively developed design variants of the hardware input device as well as the software toolkit which enables distributed camera-based tracking of the reflection caused by the infrared laser pointer. In order to assess the general feasibility of the laser pointer interaction for LHRDs, an experiment on the basis of the ISO standard 9241-9 was conducted comparing the interactive laser pointer with the current standard input device, the mouse. The results revealed that the laser pointer‘s performance in terms of selection speed and precision was close to that of the mouse (around 89 % at a distance of 3 m), although the laser pointer was handled freely in mid-air without a stabilizing rest.
Since natural hand tremor and human motor precision limit further improvement of pointing performance, in particular when interacting from distant positions, we investigate precision enhancing interaction techniques. We introduce Adaptive Pointing, a novel interaction technique which improves pointing performance for absolute input devices by implicitly adapting the Control-Display gain to the current user’s needs without violating users’ mental model of absolute-device operation. In order to evaluate the effect of the Adaptive Pointing technique on interaction performance, we conducted a controlled experiment with 24 participants comparing Adaptive Pointing with pure absolute pointing using the interactive laser pointer. The results showed that Adaptive Pointing results in a significant improvement compared with absolute pointing in terms of movement time (19%), error rate (63%), and user satisfaction.
As we experienced in our own research, the development of new input devices and interaction techniques is very challenging, since it is less supported by common development environments and requires very in-depth and broad knowledge of diverse fields such as programming, signal processing, network protocols, hardware prototyping, and electronics. We introduce the Squidy Interaction Library, which eases the design and evaluation of new interaction modalities by unifying relevant frameworks and toolkits in a common library. Squidy provides a central design environment based on high-level visual data flow programming combined with zoomable user interface concepts. The user interface offers a simple visual language and a collection of ready-to-use devices, filters, and interaction techniques which facilitate rapid prototyping and fast iterations. The concept of semantic zooming nevertheless enables access to more advanced functionality on demand. Thus, users are able to adjust the complexity of the user interface to their current needs and knowledge. The Squidy Interaction Library has been iteratively improved alongside the research of this thesis and though its use in various scientific, artistic, and commercial projects. It is free software and is published under the GNU Lesser General Public License.
Zusammenfassung
Große, hochauflösende Bildschirme (LHRD) ermöglichen sehr umfangreiche und komplexe Informationsräume auch mit hohem Detailgrad darzustellen – allerdings geht dieser wesentliche Vorteil gegenüber konventionellen Bildschirmen auch mit neuen Herausforderungen in Bezug auf die Mensch-Computer Interaktion einher. Aufgrund der hohen Bildschirmauflösung in Kombination mit einer Darstellungsfläche von mehreren Quadratmetern übertreffen LHRDs die Fähigkeiten des menschlichen Sehvermögens hinsichtlich der notwendigen Sehschärfe und der physiologisch eingeschränkten Größe des Blickfeldes. Um sowohl das gesamte LHRD zu überblicken als auch die Informationen im Detail wahrnehmen zu können, müssen sich Benutzer vor LHRDs physisch im Raum bewegen. Konventionelle Eingabegeräte wie Maus und Tastatur schränken allerdings, aufgrund der Notwendigkeit einer Auflage zur Interaktion, die Mobilität des Benutzers deutlich ein. Dies verhindert nicht nur eine effiziente und ergonomische Bedienweise von Einzelbenutzern, sondern kann sich auch negativ auf die Produktivität und Kreativität im Rahmen interaktiver Gruppenarbeit auswirken.
Um uns dieser Problemstellung zu nähern und als Basis für die Entwicklung und die Erforschung alternativer Eingabegeräte im Allgemeinen, stellen wir eine Klassifikation des Entwurfsraumes für Eingabegeräte vor. Diese theoretische Grundlage ermöglicht die generelle methodische Entwicklung und Evaluierung von Eingabegeräten sowie deren systematische Beschreibung und Einordnung. Basierend auf dieser Klassifizierung beschreiben und untersuchen wir unsere Laserpointer Interaktion, welche mit dem Ziel entwickelt wurde auch den speziellen Anforderungen für die Bedienung von LHRDs hinsichtlich Mobilität, Genauigkeit, Interaktionsgeschwindigkeit und Skalierbarkeit zu entsprechen. Im Vergleich zu der indirekten Bedienung mit der traditionellen Maus erlaubt die Laserpointer Interaktion eine natürlichere und direktere Interaktionsform mittels absoluter Zeigegestik. Wir beschreiben verschiedene Entwicklungsstufen und Designvarianten der iterativ entwickelten Eingabegeräte sowie des dazugehörigen Software Toolkits. Dieses ermöglicht die kamerabasierte Positionsbestimmung von Reflexionspunkten auf LHRDs, welche durch einen oder mehrere infrarot emittierende Laserpointer verursacht werden. Um der hohen Auflösung von LHRDs Rechnung zu tragen, erlaubt das Software Toolkit die Integration von mehreren Kameras sowie die verteilte Bildanalyse mit mehreren Prozessoren auf einem oder mehreren vernetzten Computern. Die generelle Eignung der Laserpointer Interaktion für LHRDs wurde in Form eines kontrollierten Experiments auf Basis der ISO 9241-9 untersucht. Hierbei wurde unser interaktiver Laserpointer mit dem derzeitigen Standardeingabegerät, der Maus, zur Steuerung der Powerwall der Universität Konstanz verglichen. Obwohl der Laserpointer ohne stabilisierende Auflage frei im Raum bedient wurde, zeigen die Evaluationsergebnisse, dass dessen Performanz hinsichtlich Treffgenauigkeit und Geschwindigkeit nah an den Resultaten der Maus lagen (etwa 89% bei einer Interaktionsdistanz von 3 Metern).
Auf Basis unserer Untersuchungen identifizierten wir das natürliche Zittern der Hand und die limitierte Präzision der Handmotorik als einschränkende Faktoren für die Zeigeperformanz mit absoluten Eingabegeräten, welche vor allem bei größeren Interaktionsdistanzen und hohen Bildschirmauflösungen einen deutlich negativen Einfluss ausüben. Um auch bei diesen für LHRDs typischen Rahmenbedingungen die Zeigeperformanz weiter zu verbessern, erforschten wir unterstützende Interaktionstechniken. Hierbei entwickelten wir Adaptive Pointing, eine neue Interaktionstechnik, welche die Zeigeperformanz für absolute Eingabegeräte erhöht, in dem sie implizit den Control-Display Gain an das aktuelle Benutzerbedürfnis anpasst, ohne dabei die Erwartungen des Nutzers hinsichtlich eines absoluten Zeigeverhaltens zu verletzen. Um den Effekt dieser Interaktionstechnik zu untersuchen, verglichen wir Adaptive Pointing mit einer nicht modifizierten, absoluten Zeigetechnik im Rahmen eines kontrollierten Experiments unter Verwendung des interaktiven Laserpointers. Die Evaluationsergebnisse zeigen eine signifikante Verbesserung durch Adaptive Pointing hinsichtlich der Bewegungszeit (19%), Fehlerrate (63%) und Benutzerzufriedenheit.
Die Entwicklung neuartiger Eingabegeräte und Interaktionstechniken wird Hard- und Software-technisch nur ungenügend von den herkömmlichen Entwicklungsumgebungen unterstützt. Darüber hinaus ist hierfür detailliertes Wissen aus unterschiedlichsten Bereichen notwendig, wie Programmierung, Signalverarbeitung, Netzwerkprotokolle, Prototypenbau und Elektronik. Aus dieser Problemstellung heraus entwickelten wir die Squidy Interaktionsbibliothek, welche die Realisierung und Evaluierung von neuen Interaktionsformen unterstützt und durch die konsistente Vereinigung von zahlreichen heterogenen Software-Toolkits und Frameworks wesentlich vereinfacht. Deren Funktionalitäten sind nicht nur durch eine gemeinsame textuelle Programmierschnittstelle (API) zugänglich, sondern Squidy bietet darüber hinaus auch eine eigene visuelle Entwicklungsumgebung basierend auf visueller Datenflussprogrammierung gepaart mit Konzepten für skalierbare Benutzungsschnittstellen. Hiermit können neue Interaktionsformen auf Basis von vorhandenen Einzelkomponenten und einer einfachen visuellen Sprache iterativ entwickelt und unmittelbar getestet werden. Sind erweiterte Einstellungen oder tiefergehende Anpassungen der Komponenten notwendig, sind diese bei Bedarf und selektiv durch semantisches Zoomen auf diese möglich. Dementsprechend können Benutzer die Granularität der dargestellten Informationen und der angebotenen Funktionalitäten an ihren aktuellen Bedarf und Wissensstand anpassen. Die Squidy Interaktionsbibliothek wurde auf Basis der tagtäglichen Erfahrungen im Rahmen der hier vorgestellten Forschungsarbeiten, als auch durch die Verwendung in vielfältigen wissenschaftlichen, künstlerischen und kommerziellen Projekten iterativ weiterentwickelt und verbessert. Die Squidy Interaktionsbibliothek ist Open Source und unter der GNU Lesser General Public License veröffentlicht.
Parts of this thesis were published in:
· König, W.A., Rädle, R., & Reiterer, H., 2010. Interactive Design of Multimodal User Interfaces – Reducing technical and mental complexity. Journal on Multimodal User Interfaces, 3(3), 197-212.
· König, W.A., Gerken, J., Dierdorf, S., Reiterer, H., 2009. Adaptive Pointing – Design and Evaluation of a Precision Enhancing Technique for Absolute Pointing Devices. Interact 2009: Proceedings of the twelfth IFIP conference on Human-Computer Interaction. Berlin, Germany: Springer LNCS, pp. 658-671.
· König, W.A., Rädle, R., Reiterer, H., 2009. Visual Design of Multimodal Interaction - Bridging the Gap between Interaction Designers and Developers. Workshop on the Challenges of Engineering Multimodal Interaction: Methods, Tools, Evaluation. Sankt Augustin / Bonn, Germany.
· König, W.A., Rädle, R., Reiterer, H., 2009. Squidy: A Zoomable Design Environment for Natural User Interfaces. CHI '09: Proceedings of the 27th international conference extended abstracts on Human factors in computing systems. New York, NY, USA: ACM, pp. 4561-4566.
· König, W.A., Gerken, J., Dierdorf, S., Reiterer, H., 2009. Adaptive Pointing – Implicit Gain Adaptation for Absolute Pointing Devices. CHI '09: Proceedings of the 27th international conference extended abstracts on Human factors in computing systems. New York, NY, USA: ACM, pp. 4171-4176.
· Jetter, H.C., König, W.A., Reiterer, H., 2009. Understanding and Designing Surface Computing with ZOIL and Squidy. CHI 2009 Workshop - Multitouch and Surface Computing. Boston, USA.
· Foehrenbach, S., König, W.A., Gerken, J., Reiterer, H., 2009. Tactile Feedback enhanced Hand Gesture Interaction at Large, High-Resolution Displays. Journal of Visual Languages & Computing, 20(5), 341-351.
· König, W.A., 2008. Visual and Physical Interaction Design for Information Services. Invited Talk at the international conference on Human-Computer Interaction and Information Services. Prague, Czech Republic.
· König, W.A., Böttger, J., Völzow, N., Reiterer, H., 2008. Laserpointer-Interaction between Art and Science. IUI'08: Proceedings of the 13th international conference on Intelligent User Interfaces. New York: ACM Press, pp. 423-424.
· Foehrenbach, S., König, W.A., Gerken, J., Reiterer, H., 2008. Natural Interaction with Hand Gestures and Tactile Feedback for large, high-res Displays. MITH'08: Workshop on Multimodal Interaction Through Haptic Feedback, held in conjunction with AVI'08. Napoli, Italy.
· König, W.A., Bieg, H.-J., Reiterer, H., 2007. Laserpointer-Interaktion für große, hochauflösende Displays. Mensch & Computer 2007: Interaktion im Plural, 7. Konferenz für interaktive und kooperative Medien. Weimar: Oldenbourg Verlag, pp. 69-78.
· König, W.A., Bieg, H.-J., Schmidt, T., Reiterer, H., 2007. Position-independent interaction for large high-resolution displays. IHCI'07: Proceedings of IADIS International Conference on Interfaces and Human Computer Interaction. Lisbon, Portugal: IADIS Press, pp. 117-125.
Contents
1.1 Interacting with large, high-resolution displays
1.2.1 Laser Pointer Interaction
1.2.3 Squidy Interaction Library
2 Large, high-resolution displays
3 Designing Input Devices for LHRDs
3.2 Design Space Classification
3.3.3.1 Technical Requirements and Solutions
3.3.3.3 Interactive Laser Pointer @ Design Space Classification
3.3.4.1 Participants and Design
3.3.5 Globorama: Laser Pointer Interaction between Art and Science
4 Precision Enhancing Pointing Techniques
4.2.2.1 Materials & Participants
5 Interactive Design of Multimodal User Interfaces
5.2 Squidy Interaction Library
5.2.2.3 Interactive Configuration & Evaluation
5.2.2.5 Embedded Code and on-the-fly compilation
5.2.2.6 Dataflow Visualization - Visual Debugging
5.2.3 Formative Evaluation Study
1 INTRODUCTION
![]() Contents
Contents
1.1 Interacting with large, high-resolution displays
1.2.1 Laser Pointer Interaction
1.2.3 Squidy Interaction Library
1.1 Interacting with large, high-resolution displays
Large, high-resolution Displays (LHRD) which typically provide several millions of pixels covering entire walls enable new ways of information visualization, analysis and communication. Thanks to the high display resolution, complex information spaces can be visualized in high detail and within a large context. In contrast to using conventional displays which by their nature result in aggregation or reduction of displayed information, users of LHRDs can overview a much greater amount of data and can identify interesting patterns or relations at a glance. Moreover, additional perspectives on the data can be visualized side by side facilitating multi-dimensional comparison and analytical reasoning. As a result of larger display dimensions in combination with the high resolutions, these advantageous features of LHRDs can be utilized by individual users as well as by multiple users in parallel for co-located collaboration.
A further advantage of LHRDs resulting from their large dimensions is the possibility of visualizing full-size sketches and early CAD[1]-prototypes of cars or other industrial products. Using LHRDs designers and engineers can discuss, modify, and evaluate virtual prototypes in a photorealistic, full scale setting with less need for time-consuming and expensive physical prototypes [Buxton et al. 2000]. Thanks to the realistic setting they provide, even customer studies can be conducted in the very early design phases.
LHRDs differ from conventional displays, however, not only in their technology and in their resulting features, but also in their usage especially in terms of users’ requirements, tasks, and behaviour. LHRDs are far more expensive than standard desktop displays and the utilized hardware and software technology is more complex. At least in the near future, LHRDs will not replace conventional displays but will instead be used in addition to them for specific tasks and situations in which the advantages of LHRDs are especially beneficial. LHRDs are used to a lesser degree for information creation tasks such as writing emails or papers. They are, however, being increasingly used in both industry and science for information presentation, analysis, and modification.
A great challenge and open issue in utilizing LHRDs is the method of interacting with them. In order to accomplish their tasks, users need an input technique suitable for expressing their needs such as controlling the information presentation and manipulating the displayed information.
Compared to conventional displays, LHRDs pose differing and new requirements which have to be considered: Due to the higher resolution of LHRDs, input devices are required which enable users to efficiently navigate hundreds of millions of pixels. At the same time, the input device should also offer the precision to effectively select or manipulate small objects, even if placed several meters away from the user’s position at the far end of the display. Since LHRDs match or even exceed the capabilities of the human visual system in terms of spatial resolution and field of view, physical navigation is required to a large extent in order to perceive all of the pixels and to take full advantage of these displays. Therefore, users move in front of these displays and require input devices that accommodate this necessary mobility. Moreover, such input devices should also function in a collaborative setting with multiple users and multiple identical or different devices in parallel.
We will address these challenges by introducing a novel input device – an interactive laser pointer – that is especially designed to support users in interacting with LHRDs. We will further introduce an appropriate interaction technique – Adaptive Pointing – that enhances pointing precision of the interactive laser pointer and absolute pointing devices in general in order to enable efficient and effective interaction even from distant positions as well as with high pixel densities. With these two key contributions we provide an answer to the following research question: Which input technologies are suitable for supporting users in interacting with large, high-resolution displays?
Our third key contribution does not relate to a specific input technology, but addresses the challenge of designing them. Designing novel input devices and interaction techniques is a very demanding and complex task: practical knowledge of different layers of the system and its design process is required, ranging from hardware prototyping, operating system drivers, communication protocols and signal processing, to application programming interfaces and the final application. There are tools which provide specialized functionalities such as blob detection or feature recognition. The incorporation of such tools, however, in order to enable human-computer interaction (from sensing physical properties to the transition of the system state) often fails due to the monolithic design of the tools or incompatible requirements concerning the hardware setting, operating system, and/or programming language. This complexity increases when designing multimodal interfaces which provide multiple input modalities such as speech, pen, touch or gaze input [Oviatt 2008]. We address these challenges by introducing the Squidy Interaction Library which is designed to provide an answer for the following research question: How can we support the design and evaluation of novel input devices and interaction techniques for large, high-resolution displays?
1.2 Research Objectives
In the following we will give a brief overview of the mentioned key contributions of this thesis which are discussed in detail in the chapters 3, 4, and 5.
1.2.1 Laser Pointer Interaction
Due to the high amount of pixels and the large dimensions of LHRDs, users have to move around in front of these displays to gain either in-depth knowledge or an overview. However, conventional input devices such as a mouse and keyboard restrict users' mobility by requiring a stable surface on which to operate. In order to systematically design and evaluate a new input device addressing this mobility requirement, we identify the design space of input devices in general and describe them in a new design space classification. Based on this theoretical groundwork, we introduce in chapter 3 a flexible pointing device based on an infrared laser pointer that allows identical use from any point and distance. In particular, our interactive laser pointer interaction satisfies the demands of LHRDs in the areas of mobility, accuracy, interaction speed, and scalability. The solution presented is technically designed as a generic interaction toolkit whose flexibility and general suitability was verified by using it with two very different systems – a planar 221″ Powerwall and a curved 360° panoramic display. Furthermore, a comparative evaluation study with 16 participants was conducted on the Powerwall in order to compare the performances of a conventional mouse and our interactive laser pointer by means of a unidirectional tapping test at varying distances (ISO 9241-9). The results revealed that the laser pointer‘s performance in terms of selection speed and precision was close to that of the mouse (around 89 % at a distance of 3 m) although the laser pointer was handled freely in mid-air without a stabilizing rest. However, the experiment results also suggest that, due to trembling of the user’s hand, the laser pointer’s performance deteriorates significantly with increasing distance. Since the natural hand tremor and human motor precision limit further improvement of pointing performance in particular when interacting from distant positions, we investigate precision enhancing interaction techniques and introduce a further contribution of this thesis – Adaptive Pointing.
1.2.2 Adaptive Pointing
In chapter 4, we present Adaptive Pointing, a novel approach to addressing the common problem of accuracy when using absolute pointing devices for distant interaction. First, we discuss related work concerning the problem-domain of pointing accuracy when using absolute or relative pointing devices. This motivates our introduction of a novel classification scheme for more clearly discriminating between different approaches. Second, the Adaptive Pointing technique is presented and described in detail. The intention behind this approach is to improve pointing performance for absolute input devices by implicitly adapting the Control-Display gain to the current user’s needs without violating users’ mental model of absolute-device operation. Third, we present an experiment comparing Adaptive Pointing with pure absolute pointing using a laser pointer as an example of an absolute device. The results show that Adaptive Pointing results in a significant improvement compared with absolute pointing in terms of movement time (19%), error rate (63%), and user satisfaction.
1.2.3 Squidy Interaction Library
In contrast to the pioneers of multimodal interaction, e.g., Richard Bolt in the late seventies, today's researchers in this domain can benefit from various existing hardware devices and software toolkits. Although these development tools are available, employing them is still challenging, particularly in terms of their usability and their appropriateness to the actual design and research process. In chapter 5, we present a three-part approach to supporting interaction designers and researchers in designing, developing, and evaluating novel input devices and interaction modalities. First, we present a software architecture that enables the unification of a great variety of very heterogeneous device drivers and special-purpose toolkits in a common interaction library named "Squidy". Second, we introduce a visual design environment that minimizes the threshold for its usage (ease-of-use) but scales well with increasing complexity (ceiling) by combining the concepts of semantic zooming with visual dataflow programming. Third, we not only support the interactive design and rapid prototyping of multimodal interfaces but also provide advanced development and debugging techniques to improve technical and conceptual solutions. In addition, we offer a test platform for controlled comparative evaluation studies as well as standard logging and analysis techniques for informing the subsequent design iteration. Squidy therefore supports the entire development lifecycle of multimodal interaction design, in both industry and research.
1.3 Thesis Outline
Having motivated the research objectives of this thesis in the introduction, the second chapter discusses the unique characteristics of LHRDs and gives an overview of empirical findings concerning the benefits of the increased resolution and display size as compared to conventional desktop displays. Furthermore, the limitations of the human visual system are discussed and the need for physical navigation is motivated.
Chapter 3 presents a new classification scheme for the design space of input devices in general which is the theoretical groundwork for our laser pointer interaction introduced thereafter. The hardware and software design of the interactive laser pointer is discussed and the empirical study which was conducted to assess the usability of the laser pointer is described. The chapter concludes by illustrating the Globorama installation, a real-world use case of the laser pointer.
With the aim of further enhancing the pointing performance of the interactive laser pointer (and absolute pointing devices in general), natural hand tremor and human motor precision are identified as limiting factors in chapter 4. Based on these insights and on a review of related techniques, the Adaptive Pointing technique is introduced and its mathematical descriptions are given. In order to examine the benefits of Adaptive Pointing compared to pure absolute pointing, a controlled experiment was conducted which is described at the last part of chapter 4.
An overview of existing development environments for designing novel input devices and in particular for designing multimodal interfaces is given at the beginning of chapter 5. Thereafter, the Squidy Interaction Library is introduced. The framework architecture as well as the user interface design of the visual design environment is explained. For the benefit of further design iterations a formative study was conducted which is described subsequently. The chapter concludes by presenting case studies in which the Squidy Interaction Library has already been utilized.
Chapter 6 sums up the main results of the research described in this thesis.
2 Large, high-resolution displays
![]() Contents
Contents
Large, high-resolution displays (LHRD) differ from conventional desktop monitors in various aspects. Technologically speaking, they provide larger physical dimensions as well as much higher pixel resolutions. From the user’s perspective, however, this leads to an increased need for physical navigation. When designing specific input devices for LHRDs, these particular characteristics of LHRDs as well as their consequences for human-computer interaction have to be considered. In this chapter, we will discuss these in more detail and provide an overview of the benefits of increased resolution and display size. We will furthermore discuss how the limitations of the human visual system, in terms of visual acuity and field of view, influence users’ physical navigation. This chapter motivates our research in concerning LHRDs presented in the following chapters and introduces the general theoretical and empirical background.
2.1 Characteristics of LHRDs
Large, high-resolution displays vary greatly in the technology they use and in their geometry. However, they have in common, that their resolution and physical size are much larger than conventional desktop displays. For the sake of clarity we have categorized today’s displays into the four main classes illustrated in Figure 1. The class of LHRDs contains displays which are large enough to enable multiple users to work in parallel – in contrast to desktop monitors that are designed for single-users. In addition, the LHRDs provide an amount of pixels large enough for visualizing very complex information spaces, roughly starting with three to five million pixels. Thanks to recent advances in display technology, LHRDs can be build that even offer hundreds of millions of pixels. Thus, the class of LHRDs covers a wide range of resolutions and heterogeneous display technologies. In the following sections, we will discuss two factors – display resolution and physical size – while focusing on their impact on human-computer interaction and their implications for the design of suitable input devices.

Figure 1: Display classification schema – four categories and corresponding examples distinguished by the dimensions display resolution and physical size.
2.1.1 Display resolution
LHRDs offer resolutions that are multiple times higher than those of current standard high-definition displays (1920 x 1080 pixels). With such an increased amount of pixels, very complex and large information spaces can be visualized at a glance. This is a key advantage of LHRDs for many research and application fields such as Information Visualization or Visual Analytics; a vast amount of data can be represented in great detail without sacrificing context or content. Here, human judgement is needed for finding relevant patterns or interesting values [Thomas & Cook 2005]. LHRDs provide the possibility of visualizing large information sets in great detail as well as allowing for additional perspectives on the data, accentuating specific features such as time dependencies or spatial relations (e.g., based on the concept of multiple coordinated views [North & Shneiderman 2000]). Thus, the user is able to obtain an overview of the data and to find and compare interesting items simultaneously. Thanks to the increased resolution as compared to conventional displays, LHRDs facilitate human insight, discovery and analytical reasoning in general. Using conventional displays with lower resolutions, even medium sized information spaces have to be reduced and/or clipped in order to fit on these displays. These reductions in information quantity could potentially hide interesting information by clustering or aggregation. LHRDs are also limited in their amount of pixels, but provide very high resolutions that even surpass human visual capabilities (see section 2.3, p. 31). Users are less restricted by the LHRDs and therefore are able to fully utilise their perceptual abilities.

Figure 2: The „Visible Human Female“ data set is rendered in high-resolution on the GRIS Display Wall in Tübingen with a resolution of 10240 x 6400 pixels and a size of 2.8 x 2 meters. The wall consists of 4x4 30-inch LCDs and is powered by a cluster of 16 high-performance computers [Parys & Knittel 2009].
From a technical perspective, there are two major approaches for achieving high display resolutions such as those offered by LHRDs: tiled LCD[2] panels and projection-based seamless displays [Ni, Schmidt, et al. 2006]. A tiled LCD panel (see Figure 2) consists of an array of multiple LCD displays that are arranged as flat or curved display walls. The arrangement of the individual LCDs is very flexible, but introduces borders between each tile breaking up the continuity of the LHRD. The display bezels segment the LHRD which then causes a visual distortion of the displayed image and an interaction distortion when the cursor crosses the bezels [Robertson et al. 2005]. Projection-based seamless displays avoid these distortions by combining multiple projectors which are arranged in an array in order to generate a single and homogeneous large, high-resolution image (see Figure 3). These displays can have almost any shape and size, but the configuration of the projection geometry and the calibration of the individual colour and brightness levels are rather complex. In comparison to the LCD solution, these projectors are more expensive and require more space due to the optical projection distance, but they provide the great advantage of a seamless image and the potential for stereoscopic imaging.

Figure 3: PixelMap Visualization of the US census data is displayed on the Powerwall of the University of Konstanz[3]. The Powerwall offers a resolution of 4640 x 1920 pixels and a size of 5.2 x 2.15 meters. The rear-projection display is driven by 8 projectors that render a very homogeneous image thanks to soft-edge blending and image synchronization.
The interactive rendering of high-resolution images with millions of pixels is a very performance- and memory-consuming task that exceeds the capabilities of standard graphics cards. Specialized high-end multi-GPU visual computing systems such as the NVIDIA Quadro Plex[4] offer the possibility of rendering images with a total resolution of almost 36 megapixels[5]. However, the actual interactivity of the system – measured in frames per second – depends highly on the rendering engine of the application (e.g. OpenGL, Direct3D, or GDI) and the type of data (e.g. pixel, voxel, or vector graphics). These visual computing systems can be connected to a conventional computer and act – from users’ perspective – like a standard graphics card: there is no need for software modifications or special restrictions when rendering applications on a LHRD with these solutions. However if higher resolutions or faster frame rates are required more scalable solutions are needed. An alternative and more modular approach is based on the combination of multiple high-performance graphics computers for cluster-based rendering. Here, the rendering process is distributed over a set of computers that are connected via a high-throughput network [Staadt et al. 2003]. In the last years several software toolkits have been developed which manage the distribution of the rendering operations and their synchronization over the network. However, these toolkits are limited to specific rendering engines (e.g. the Chromium toolkit [Humphreys et al. 2002] extends the OpenGL engine) and require code modifications of the applications to be distributed (e.g. OpenSG [Voß et al. 2002], VRJuggler [Bierbaum et al. 2001], and Equalizer [Eilemann et al. 2009]). Thus, the usability of LHRDs driven by such distributed rendering solutions is limited, since proprietary software such as Microsoft Powerpoint cannot be modified to function with these toolkits.
2.1.2 Physical display size
The second differentiating characteristic of LHRDs is their physical size, more precisely, the physical dimension of the displayed viewport. The dimensions of LHRDs are typically much larger than conventional desktop displays. The Powerwall at the University of Konstanz, for example, has a display diagonal of approximately 221 inches (see Figure 3), which is about 10 times larger than a current standard desktop display. With physical dimensions of 5.2 x 2.15 meters the Powerwall covers an entire wall and enables – along with its high resolution – multiple users to work together or in parallel independently. Large, low-resolution projections are widely-used for presentation environments, but provide too few pixels to accommodate multiple user settings, e.g., individual display space and focus. In contrast, LHRDs are suitable for use as shared displays enabling multiple users to work in parallel while adhering to social protocols of personal space and without the need of formal turn-taking [Tuddenham & Robinson 2006]. They support group communication as electronic whiteboards or peripheral displays e.g., for brainstorming sessions [Guimbretière et al. 2001]. They facilitate social and situational awareness that are crucial for co-located team collaboration [Kulyk et al. 2008], [Greenberg & Rounding 2001]. Furthermore, LHRDs can be used to provide lightweight information about group activity [Huang & Mynatt 2003] and thus support shared activities and knowledge.
A further advantage of LHRDs resulting from their large dimensions is the possibility of visualizing full-size sketches and early CAD[6]-prototypes of cars or other industrial products. Using LHRDs designers and engineers can discuss, modify and evaluate virtual prototypes in a photorealistic, full scale setting with less need of time-consuming and expensive physical prototypes [Buxton et al. 2000]. Thanks to the realistic setting they provide, even customer studies can be conducted in the very early design phases.
“Getting the styling of the car correct early in the design process is extremely important. In this, the scale at which the designs are rendered play a surprisingly critical role. For example, the primary curves that define a car’s style may look perfectly fine at quarter scale but elicit a completely different emotional response at full scale.” [Buxton et al. 2000].
Thus, LHRDs can improve and shorten the development lifecycle in engineering and design by visually communicating ideas in better quality and realistic size and by facilitating group discussion and customer involvement.
Another advantage stemming from LHRDs’ large dimensions is the potential for physically exploring them. On conventional displays the user navigates an information space in a purely virtual manner by changing the current viewport via mouse or keyboard input, resulting in an accordant replacement of the displayed information on the screen (e.g., panning on a geographical map). Thanks to the physical dimensions of LHRDs the user has – in addition or as an alternative to virtual navigation – the ability to physically navigate the information space by bodily movement in front of the screen [Ball & North 2005]. This means that instead of changing the displayed information with virtual navigation, on LHRDs the information can remain but the user changes her position and orientation for navigation (eye-, head-, or body-movement). For example, the user steps forward to see details or steps back to obtain an overview (see section 2.3.1, p. 31 for details about human visual acuity).
Physical navigation offers a very direct and natural mode of interaction since it builds upon our elementary navigation strategies from the real world and by this no additional cognitive load is introduced (e.g., handling of the input device, manual control of viewport, and reorientation in the changed information view). Although physical navigation is more direct and natural and needs less cognitive load, it is questionable as to whether or not its usage is as efficient as virtual navigation. If a significant change of the viewport is desired and an eye- or head-movement is not sufficient, the user has to move her body to the required location – instead of moving a (small) input device for virtual navigation. In the last years several empirical experiments were conducted that address the question of efficiency and the general benefits of LHRDs resulting from the higher resolution and the larger physical dimensions.
2.2 Evaluation studies
Shupp et al. [2006] investigated user performance time, accuracy, and mental workload on geospatial search, route tracing and comparison tasks with different display resolutions and physical sizes. They compared a single monitor configuration (1280 x 1024 pixels) to a tiled LHRD with 12 monitors (4 x 3 display array with 5120 x 3072 pixels) and a tiled LHRD with 24 monitors (8 x 3 display array with 10240 x 3072 pixels). They found that user frustration was significantly less with larger displays. The participants tended to use more physical navigation (although this was limited by the provided input devices) and less virtual navigation in the larger display conditions and this change also correlated to improved user performance. They concluded that the participants might have benefited from the naturalness of physical navigation and the reduction of potential frustrations of virtual navigation [Shupp et al. 2006].


Figure 4: Tiled LCD panel with 24 monitors as flat (left) and as curved (right) wall display [Shupp et al. 2006].
In the same experiment, Shupp et al. [2006] also investigated the effect of the curvature of the display as an additional independent variable. They compared the flat configuration of the tiled LCD to a horizontally curved variant (see Figure 4). The experiment results showed that curving the display around the user decreased task time regardless of the viewport size (12 versus 24 monitors). Of all display conditions, user performance was the best on the curved twenty-four monitor condition [Shupp et al. 2006]. In the flat condition, the user had to cover a large distance to get from the left to the right border of the display. The curved configuration had the advantages that all pixels of the display had the same distance to the centre point and that this distance was defined according to the human visual acuity (see section 2.3.1, p. 31). Thus, all pixels were resolvable solely with head and eye movements and less physical walking was required. This optimality in display curvature, size and resolution also implies a great disadvantage: The curved design does not scale well with increasing display resolution and size, since human visual acuity limits the maximum viewing distance (radius of the circular arc) depending on the pixel density (resolution/size). Furthermore, the restricted space inside the curved display also limits the number of users and thus constrains multi-user interaction as well as co-located collaboration.
In a follow-up study, Ball et al. [2007] examined in particular the relationships between display size (viewport), amount of physical and virtual navigation, and user task performance in the context of LHRDs. The experimental setting of the above mentioned experiment of Shupp et al. restrained users in their physical movement while interacting with the system since the provided input devices mouse and keyboard required a stable surface (e.g. a table) for their proper operation (see Figure 4). Ball et al. also used the flat 8 x 3 tiled LCD panel, but provided participants with a wireless Gyration mouse that offers the flexibility to interact in mid-air (see Figure 5 left & right). Hence, the participants had the full mobility while interacting with the LHRD. In order to measure the extent of participants’ physical navigation, they wore a hat equipped with retro-reflective markers which were tracked by an infra-red tracking system (see Figure 5 centre).


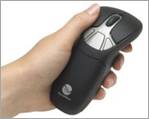
Figure 5: Participant using the wireless Gyration mouse with the 8x3 tiled LCD panel (left); the hat used to track participants’ position (centre) [Ball et al. 2007]. Wireless Gyration[7] mouse (right).
The 32 participants performed four different tasks on a geographic map of the Houston area with embedded geo-referenced data about 3,500 houses for sale: navigation to a target, search for a target, pattern finding for a group of targets, and open-ended insight for a group of targets. For the navigation tasks, the participants were asked to navigate to a given house on the map and to read aloud the corresponding attributes of the house. The house was already shown on the screen, but in order to see the textual attributes navigation (zooming) might have been required (dependent on the display condition). For the search task, participants had to find houses that had particular attributes (e.g. a price between $100,000 and $110,000). In the pattern finding tasks, participants were asked to identify specific clusters or correlations of the displayed houses or their attributes. The insight tasks were designed as open-ended tasks in which participants wrote down insights gained in the experience. No performance time was measured in the insight task and participants were given a rolling lecture stand on which to write. This task is sparsely described in the paper and the physical constraints limit its value for this discussion. The first three tasks, however, required a range of levels of detail, and hence participants had to navigate (zooming) physically and/or virtually.
The participants performed the navigation and search tasks (within subject design) on all eight viewport width conditions (from 1 to 8 display rows each time with 3 displays in the vertical direction). For all display conditions, the task began with a best fitting overview of the same area of Houston. Although the displayed map sections were slightly different due to the different aspect ratios of the viewport conditions, the participants received the same starting point and a similar overview. However, the larger display conditions showed more details at once thanks to the increased amount of screen pixels available (higher resolution).
The results showed a significant effect of viewport width on performance times for the navigation and search tasks. For example, for the navigation task, the performance time was reduced by a factor of 3.5, from 18.6 seconds on the one column display setup to 5.2 seconds on the eight column display setup [Ball et al. 2007]. In the search task, performance was reduced by a factor of 2. In summary, the results showed that larger viewport sizes lead to a significant and considerable improvement of task performance, at least for navigation and search tasks. There was only a near-significant trend for the pattern finding task.
Analogous with performance time, the amount of virtual navigation (zooming and panning via wireless mouse) also decreased with increasing viewport size. Ball et al. [2007] found that the number of virtual zooms and pans correlated with performance, while physical distance travelled did not. Physical navigation seems to be more efficient, since the larger viewports also lead, in general, to more physical navigation, but decreased performance time. The performance advantage of the usage of LHRDs is not only caused by less virtual and more efficient physical navigation; the participants also changed their navigation strategies and heuristics with increasing display size. As the participants were given the ability to see more of the overview and details at once, they were generally observed to make more intelligent navigation decisions [Ball et al. 2007].
A further interesting finding of Ball et al. [2007] concerns the subjective preference of the participants. When possible, participants preferred to physically navigate. For several task conditions, all 32 participants chose to use only physical navigation to complete their task. Ball et al. [2007] observed that participants first physically navigated as much as possible before virtually navigating. This subjective preference is also underlined by an initial study of Ball & North [2005] in which they reported that the participants felt less frustration with larger viewports and had a greater sense of confidence concerning their responses. These results are also in line with the findings of Shupp et al. [2006] discussed before.
All of the thus far discussed experiments used the parameters display resolution and display size as a combined variable and manipulated both together by switching on more display tiles on a tiled LCD panel. Although both resolution and display size are the main parameters separating conventional displays from LHRDs, they can have different effects on the experimental results or on the benefit of a particular display in general. From these experiments, it is not clear, if higher resolution or larger physical size leads to the better user performance, and if consequently one of them would be sufficient for producing similar results.
Ni et al. [2006] separated the parameters display size and resolution by comparing four different display conditions, consisting of two different display sizes (21.6 versus 55 inches in diagonal) and two different resolutions (1280 x 720 versus 2560 x 1440 pixels, see Figure 6). Another difference between this and the previously discussed studies is the task domain. The 32 participants were asked to navigate in an Information-Rich Virtual Environment (IRVE), a three-dimensional multi-room art museum, in contrast to the previous studies in which participants navigated in a two-dimensional geographic map. However, all experiments had in common that a two-dimensional projection technique was used (instead of stereoscopic imaging).

Figure 6: Display variants to evaluate individual and combined effects of display size and resolution on task performance: IBM T221 LCD as small display with high and alternatively low resolution (left). Rear-projection screen as large, low-resolution display (centre). VisBlocks: projection-based large, high-resolution display (right) [Ni et al. 2006].
The participants were asked to navigate through the virtual museum while searching for and comparing different paintings and their metadata (e.g., artist or price). The results revealed significant main effects of both size and resolution. The display size seemed to play a dominant role, since the participants performed with both large display setups better than with the small setups (independent of their resolution). Ni et al. [2006] also reported that the participants felt more present when experiencing large displays.

Figure 7: Average task performances for the two resolution (low/high) x two display size (small/high) conditions. Results show main effects of display size and resolution. Error bars illustrate standard errors [Ni et al. 2006].
Overall, the large, high-resolution display outperformed the other three conditions. In this setup, participants could make use of peripheral vision for navigation and orientation and they were also able to see more labels at once. This effect is remarkable since the resolution of the large, high-resolution display (3.7 megapixels) in this experiment was not very high compared to the LHRDs used in the previously discussed experiments (31.5 megapixels in the 8 x 3 condition of Shupp et al. [2006] and Ball et al. [2007]).
In summary, the experiments showed that LHRDs are beneficial for users at least when navigating in two- and three-dimensional information spaces and searching for as well as comparing information objects. The higher resolution and larger display sizes of LHRDs compared to conventional desktop displays enable better task performances, but also offer subjective advantages. The participants were less frustrated and benefited from the naturalness of physical navigation [Shupp et al. 2006]. They had more of a sense of confidence about their responses [Ball & North 2005] and felt more present in the larger and thus more immersive display conditions [Ni, Bowman, et al. 2006]. Moreover, the participants were generally observed to make more intelligent navigation decisions when using the LHRDs [Ball et al. 2007]. In general, the increased display size and resolution lead to more physical navigation, although the LHRDs are able to visualize all relevant information at once. The reason underlying the increased amount of physical navigation is quite obvious when considering the human visual capabilities.
2.3 Human visual capabilities
With recent advances in technology, LHRDs providing hundreds of millions of pixels covering entire walls can be constructed. One of the LHRDs with the highest resolution worldwide (see Multi-Megapixel Display List[8] for the ranking) is the Stallion cluster of the Texas Advanced Computing Center that provides 307 megapixels based on a flat 15x5 tiled LCD panel (see Figure 8). Here, the pixel pitch, the size of a single pixel, is just 0.25mm, but the entire display has a width of over 10 meters. Thus, the user has to come close to the display to perceive the detailed information represented by a few pixels or to step back to overview the entire LHRD from a distant position. This physical navigation of the user is caused by the limitation of the human visual system in terms of visual acuity and field of view.

Figure 8: Stallion Cluster at the University of Texas: Ultra high-resolution display with 15x5 30 inch Dell LCD monitors and an overall resolution of 307 megapixels[9].
2.3.1 Visual acuity
The ability of a person to visually resolve a spatial pattern is referred to as visual acuity. This term was coined by Franciscus Donders (1818-1889) to describe the sharpness of vision. Herman Snellen (1834-1908) later defined normal visual acuity as the ability to resolve a spatial pattern separated by a visual angle of one minute of arc. Thus, if a user is to be able to perceive an individual pixel (0.25 mm) on the Stallion Cluster, for example, she has to be closer than 85.9 cm to the display wall (see Equation 2). With larger viewing distances the individual pixels merge with their neighbours and the information represented on the pixel-level disappears. Since the Stallion Cluster has a display width of more than 10 meters, it is clear, that there is no single position from which a person will be able to perceive all 307 megapixels. Thus, the user perceives and explores the information displayed on a LHRD as she is accustomed to explore information in the real world (e.g., searching for a book in a large book shelf) by physically moving in front of the LHRD.

Figure 9: Visual angle α of an object measured from the optical centre of the eye (adapted from [Ware 2004]).
![]()
Equation 1: Calculation of the visual angle α with viewing distance d and object size h.
![]()
Equation 2: Calculation of the maximal viewing distance to perceive and distinguish between individual pixels (visual angle α = 1/60°) with normal visual acuity (also noted as 20/20 vision).
However, for certain visualization techniques and information spaces, it is critical to be able to see each individual pixel, such as the PixelMaps technique used to visualize census data in Figure 3. In order to read a displayed text it is also essential to be able to distinguish the different characters. The Latin alphabet has several characters that look very similar and only a single or few pixels separate them from each other with common font types and sizes:
il ij fl l! oc EF QO 83 ‘’ ,. ,;
If the viewing distance is too large the characters blur and i, l or ! look practically identical, for example. The importance of this challenge is underlined by the fact that reading characters (standardized optotypes) is the most common method of assessing individual visual acuity (see Figure 10).
For other information domains it could be useful for at least neighbouring pixels to merge, for example when rendering photorealistic images where the perception of an individual pixel could compromise the naturalness of the image. Here, the visualization on the LHRD should create the illusion of a continuous real-world but with the help of discrete pixels, thus a slightly larger viewing distance could be beneficial (e.g., neighbouring pixels merge for viewing distances roughly between 86 cm and 172 cm in the Stallion Cluster). However, if the viewing distance becomes too large, small details also become imperceptible. There is thus no optimal viewing distance for a display, but there is an appropriate range of distances for a specific information content and layout. Since LHRDs are mostly wider and higher than this distance span, users have to move physically in front of a LHRD in order to perceive all displayed information from the upper-left to the lower-right display corner. An exception to this could be a spherical LHRD, since the distance between each pixel and the centre is identical (radius of the sphere) and can be optimized dependent on the desired pixel density and information visualization, but this high degree of specialisation makes the usage of such a display very inflexible. However, a further limitation of the human visual system makes physical navigation – even in a spherical display – inevitable.

Figure 10: Snellen chart[10] with different sizes of standardized optotypes to assess human visual acuity.
2.3.2 Field of view
Due to the placement of human eyes, the binocular field of view covers roughly about 180 degrees horizontally (forward-facing) [Ware 2004]. That means when a human with normal vision gazes straight ahead, the light reflected off of or originating from objects placed in a horizontal angle of about ± 90 degrees of the viewing direction impinges one (monocular) or both (binocular vision with depth information) of her retinas. The field of view with binocular vision covers only about 120 degrees horizontally. The vertical field of view is much smaller than the horizontal as is illustrated in Figure 11. Users’ at a glance experience is therefore limited by the visual field of view. This fact limits our ability to analyse large information spaces quickly large information spaces and to compare information objects directly. However, this is further limited by the anatomy of the eye and the distribution of its visual receptors.
The type of visual receptors and their density is unevenly distributed on the retina. The area with the highest resolution and the best colour sensing, which consequently is the area with the best acuity, is very small and roughly at the centre of the retina. This area is named fovea and covers only about two degrees of the field of view [Dowling 1987]. Humans perceive their environment by saccadic movements of the eyes in order to position the fovea in the direction of interesting details followed by a short fixation. Thus, there is already physical movement needed to successively build up a clear mental image of one’s environment or the information visualized on a LHRD. However, the saccadic movements are mostly subconscious, very direct and require minimal physical exertion. More physical navigation is needed if the desired information is on the border or outside of the field of view. Therefore, eye movements are combined with head and body movements, increasing physical load and the degree of consciousness associated with the movements.
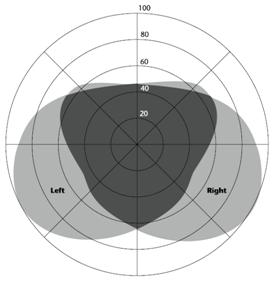
Figure 11: The human visual field of view when gazing straight ahead. The fields are constrained by facial features e.g. the nose. The darker-gray overlap shows the region of binocular vision [Ware 2004].
As previously discussed, spherical displays provide the advantage that all pixels are equidistant to the centre and the pixel density can be optimized for human visual acuity. Due to the limited field of view, however, this solution also requires physical navigation (at least head and bodily movement) of the user to perceive all parts of the display. That applies likewise to cylindrical displays such as the 360° ZKM PanoramaScreen illustrated in Figure 12.

Figure 12: 360° PanoramaScreen of the ZKM Karlsruhe[11] displaying the artistic installation Globorama. User move physically inside the immersive display and explore the virtual world with the help of an interactive laser pointer [König et al. 2008].
2.4 Summary
Wall-sized displays with millions of pixels offer various advantages compared to conventional desktop monitors. The increased display real estate of LHRDs provides the possibility of visualizing very complex information spaces at a glance. In addition to virtual zooming and panning, the user is also able to physically explore the “information wall” and to utilize natural navigation strategies well-known from the real-world. Several empirical studies have shown that LHRDs enable better performance times for navigation, search and comparison tasks as well as giving users more of a sense of confidence. However LHRDs also introduce new challenges for the design of appropriate input devices. A fundamental requirement is support for physical mobility while interacting with a LHRD. Conventional input devices such as a mouse and keyboard require a stable surface which impedes free movement and fluid interaction. We will address this challenge in the next chapter, introducing an input device specially designed to enable interaction with LHRDs even from distant positions.
3 Designing Input Devices for LHRDs
![]() Contents
Contents
3.2 Design Space Classification
3.3.3.1 Technical Requirements and Solutions
3.3.3.3 Interactive Laser Pointer @ Design Space Classification
3.3.4.1 Participants and Design
3.3.5 Globorama: Laser Pointer Interaction between Art and Science
In the previous chapter we discussed the specific characteristics of LHRDs and the benefits of their usage as compared with conventional desktop monitors. However, they also introduce new challenges for human-computer interaction, particularly for the design of suitable input devices. Due to the higher resolution of LHRDs, input devices are required that enable users to efficiently navigate hundreds of millions of pixels. At the same time, the input device should also offer the precision to effectively select or manipulate small objects, even if placed several meters away from the user’s position at the far end of the display (e.g., activating the Windows Start Button at the lower-left corner or the Close Button (x) on the upper-right corner in case of a standard Microsoft Windows desktop). Moreover, not only has the distance between the user and the display increased tremendously compared to a conventional desktop monitor setting, but this distance can also vary dramatically. Since LHRDs match or even exceed the capabilities of the human visual system in terms of spatial resolution and field of view – as discussed in the previous chapter – to a large extent physical navigation is required to perceive all of the pixels and to take full advantage of these displays. Therefore, users move in front of these displays and require input devices that accommodate this necessary mobility. This critical requirement poses several fundamental issues: the device should work wirelessly (in terms of data transmission and power supply), should be easy to transport (lightweight and comfortable handling), should work anywhere in front of the LHRD (without restrictions such as a table as in the case of mouse input), and the interaction speed and accuracy should scale well with larger distances and extreme positions. Moreover, this device should also function in a collaborative setting with multiple users and multiple identical or different devices in parallel.
In order to investigate these requirements more systematically we created a classification scheme for the design space of input devices in general and the corresponding usability measures. This will enable interaction designers to explore diverse design alternatives and to discuss and evaluate them systematically. Based on this groundwork we developed a new input device that is designed specifically to fulfil the particular needs of users interacting with LHRDs: an interactive laser pointer that offers fast and precise interaction from almost any position and distance. We will discuss the hardware and software design of our solution in the following sections and present an empirical study we conducted to assess the usability of the laser pointer method of interaction. Furthermore, we will present an example use case of the laser pointer: the artistic installation Globorama. Here, the laser pointer was used in two exhibitions with thousands of visitors. This offered the opportunity to complement the empirical findings of our experiments with more qualitative insights gained through observations and questionnaires in a real world scenario.
3.1 Design Space & Measures
“Input devices sense physical properties of people, places, or things”, [Hinckley 2008]. They are the controls enabling humans to embody their mental actions in digital operations. A simplified model of the human-computer interaction is illustrated in Figure 13. The communication can be seen as a closed-loop system where the human receives information about the current machine state by visual stimulation provided by a display, the output device. Also other human senses can be incorporated in the information transmission such as hearing, touch, or proprioception. The human perceives and processes the information and responds by using the input devices resulting in a manipulation of the machine state. The terms input and output are defined with respect to the machine [MacKenzie 1995]. Typically, input devices are controlled by human limbs such as hands, arms, and feet. However, input devices can also track eye and head motions, interpret speech commands or even translate specific activation patterns of the human brain into predefined digital operations (e.g., moving an object).

Figure 13: The human-machine interface, a closed-loop model of the human-computer interaction with input and output devices as intermediaries. The input devices are the controls humans manipulate in order to change the machine state [MacKenzie 1995].
Over the last 35 years, several taxonomies for input devices have been presented, each focusing on specific properties and covering the input devices of their time. Foley & Wallace [1974] discovered common data types and features shared by all input devices in the context of interactive computer graphics. They defined five primitive virtual devices that can be used to represent or simulate the full variety of input devices and their data types. The assumption was that “[...] every physical input device can be treated as a physical realization of one, or several, of just five distinct virtual devices: the pick, the button, the keyboard, the locator, and the valuator”, [Wallace 1976]. The main intention was to achieve device independency in order to facilitate program portability, reusability of existing algorithms, and interface standardization.
· Locator: the locator is a virtual device used to indicate a position and/or orientation with respect to the display space. Prototypes of the locator are pointing devices such as the mouse or the joystick.
· Pick: the pick is used to designate user defined objects (e.g., drawn lines, curves, or text) by directly pointing on it. A prototype of the pick is a lightpen. The pick produces a hit event which carries a reference to the selected graphics object (in contrast to the locator that carries the location without referencing objects).
· Button: with the button a predefined program action can be performed including the generation of a specified symbol or a function key. The button can be combined with a pointing device in order to trigger a selection (e.g., mouse button) or multiple buttons can be bundled together simulating a keyboard.
· Keyboard: the keyboard is a virtual device that is used to input text using standardized characters.
· Valuator: the valuator is used to determine a numerical value. A prototype for a one-dimensional valuator is a potentiometer.
Foley & Wallace [1974] defined these virtual devices based on their experiences in the interactive computer graphics domain and focused on improving efficiency by identifying common features between existing input devices. When designing new input devices, however, it can be more inspiring to observe device differences and specific characteristics. Buxton [1983] introduced a taxonomy for continuous input devices that illustrates the diversity of the devices and the design space in general based on a tabular categorization (see Figure 14). He identified several independent design dimensions that form the design space: the dimensionality of the input (1D, 2D, 3D), the property that is being sensed (position, motion, pressure), the agent of control (hand, foot, voice), and the interaction directness (touch or mechanical intermediary).

Figure 14: Tableau of Continuous Input Devices (adapted from [Buxton 1983]). The input devices are categorized by the first order dimensions property sensed (rows) and number of dimensions sensed (columns). “Subrows distinguish between devices that have a mechanical intermediary (such as a stylus) between the hand and the sensing mechanism (indicated by M), and those which are touch sensitive (indicated by T). Subcolumns distinguish devices that use comparable motor control for their operation” [Buxton 1983]. An updated online version is available at http://www.billbuxton.com/lexical.html.
Card et al. [1990] extended the taxonomy of Buxton by also integrating discrete input devices such as a keyboard. Similar to Buxton’s Tableau of Continuous Input Devices, the taxonomy of Card et al. is also represented in a tabular matrix, but it provides more details concerning the dimensions and the classified input devices (see Figure 15). The dimensionality is split explicitly into linear and rotary dimensions, and each sensing feature of an input device is represented on its own (e.g., a three-button mouse senses linear movements in the x- and y-dimension and tracks the position of three physical buttons). This taxonomy is more expressive; however it covers relatively few design dimensions and does not cover the entire design space of input devices (e.g., hardware design or mobility). Therefore, both taxonomies provide a good framework to categorize, discuss and illustrate the diversity of input devices, but focus only on some major dimensions and high-level properties. When designing new input devices, a complete description of the fundamental dimensions spanning the design space would be helpful, enabling a more systematic approach to design and engineering.

Figure 15: Input device taxonomy of Card et al. [1991] representing a three-button mouse and a radio control with station chooser (slider), selection-knob (OFF, AM, FM) and volume control. “Circles are used to indicate that a device senses one of the physical properties shown on the vertical axis along one of the linear or rotary dimensions shown on the horizontal axis. For example, the circle representing the radio volume control indicates a device that senses an angle about the Z axis. The position in a column indicates the number of values that are sensed (i.e., the measure of the domain set). For example, the circle representing the selection control represents a discrete device. Lines are used to connect the circles of composite devices. A black line represents a merge composition (such as the X and Y components of the mouse). The dashed line represents a layout composition (such as the three buttons on a mouse, represented by a circle with a 3 in it to indicate identical devices)”, [Card et al. 1991].
3.2 Design Space Classification
In order to achieve a more thorough description of the design space we conducted a literature review concerning input device taxonomies, classifications, and evaluation methods. We extracted features that describe the functionality and quality of an input device with respect to human-computer interaction. We categorized these features along the high-level classification of MacKenzie [1995] who distinguishes between device properties and parameters, as follows:
“Properties are the qualities which distinguish among devices and determine how a device is used and what it can do“, [MacKenzie 1995]. The features presented by Buxton and Card et al., such as dimensionality and sensed property can be classified as device properties, for example. These properties are specified by the interaction designer and fixed by the utilized sensing technology and hardware design. A mouse, for example, senses movements in two dimensions. This property is based on a design decision and cannot be adjusted or optimized without changing the general functionality of the input device.
“A parameter is any characteristic of a device or its interface which can be tuned or measured along a continuum of values“, [MacKenzie 1995]. Parameters are features of the specific device implementation, such as the weight of the hardware device or the resolution of the sensor. Higher sensor resolution can be beneficial for interaction speed and accuracy, but would not change the overarching interaction concept – in contrast to the device properties.
We therefore project our analysis of the design space onto these two major categories that help to describe the functionality of an input device. In order to assess the quality of an input device, diverse measures can be used, each of which focuses on specific aspects. We complement our categorization of the design space by illustrating an example set of usability measures that are suitable for assessing the quality of input devices with respect to human-computer interaction. This assortment of measures derives from our literature review and is categorized with respect to the [ISO-9241-11: 1998] that defines effectiveness, efficiency and satisfaction as the main usability measures. An overview of our classification is illustrated in Figure 16 and the individual items are discussed below.

Figure 16: Classification of the design space of input devices and corresponding usability measures.
·
Input
Device properties
o
Physical property sensed
Category: Input device properties
Reference: [Buxton 1983], [Hinckley 2008], [Jacob 1996]
Input devices sense physical aspects or properties
of the user, the user’s environment, or the hardware input device itself. The
most common physical properties being sensed are position, motion,
and pressure. For example, touch screens track the absolute position of
a finger, a mouse measures relative movements (the change in position), and
isometric joysticks measure the pressure imposed by users upon the stationary
stick (e.g., IBM pointing stick). However, other physical properties can be
utilized for human-computer interaction as well, such as room or body
temperature, light intensity, sound level, electric current, or capacity.
o
Type of motion
Category: Input device properties
Reference: [Card et al. 1991], [Hinckley 2008], [Jacob 1996]
When sensing position, motion, or pressure, the
direction of the force imposed by the user can be differentiated. For example,
physical sliders or buttons offer a linear movement in contrast to
rotary knobs that offer angular modifications. In case of gestures
(e.g., finger, stylus or mouse gestures), combinations of linear and angular
motions are often used in order to trigger predefined commands, to sketch
geometric shapes, or to write characters.
o
Continuous vs. discrete input
Category: Input device properties
Reference: [Buxton 1983], [Jacob 1996]
Currently, there a two larger groups of input devices that are mostly described
as pointing devices (e.g., mouse) and text input devices (e.g., keyboard). A
more formal differentiation is based on the type of their input set: continuous
versus discrete input. Continuous input devices such as pointing devices sense
physical properties of an analogue, continuous world with an infinite set of
input values (infinite domain set) – although, from a technological point
of view, the input values are discretized by the digital sensing technology.
Keyboards, buttons in general, and also some rotary knobs provide discrete
input, since they are designed to handle only a finite number of input
values. They provide a limited number of states – mostly only two:
key/button pressed and key/button released.
o
Degree of freedom
Category: Input device properties
Reference: [Buxton 1983], [Hinckley 2008], [Jacob 1996]
The degree of freedom (DOF) specifies the total number of dimensions an input
device senses. A button senses linear movement in one dimension, a mouse
measures relative movements in two dimensions, and – with the help of an
optical tracking system – the position of objects equipped with
retro-reflective markers such as a flystick can be tracked in a
three-dimensional space. Moreover, if the orientation of the flystick can also
be identified, the flystick provides a total of six degrees of freedom. Most
pointing devices are augmented with buttons to trigger selections or special
short-cuts. The degree of freedom of such a composite device increases with the
number of buttons (e.g., 6 DOF Flystick + 2 Buttons = 8 DOF). The three spatial
dimensions belonging to the tracking in space are closely related, since users
can change the values in all three dimensions by performing just one action:
moving the flystick along the space diagonal, for example. These related
dimensions are called integral dimensions. The dimensions of the buttons
in the flystick example have to be modified independently and thus are denoted
as separable dimensions [Jacob 1996].
o
Agent of control / input modality
Category: Input device properties
Reference: [Buxton 1983]
In order to communicate with computers, humans may utilize diverse interaction
modalities. They can voice verbal commands, move physical input devices by
hand, point with finger gestures to control the screen cursor, select objects
by looking at them, change values with foot pedals or in the future may navigate just by thinking – just to mention
some examples. Although the most common input devices, mouse and keyboard, are
controlled manually, humans’ capabilities of communicating are very rich. Multimodal
interfaces support two or more user input modes that can be used either individually
or simultaneously [Oviatt 2008]. Most multimodal interfaces are implemented by combining the
interaction data of multiple unimodal input devices such as voice commands and
finger positions (e.g., Put-that-there, [Bolt 1980]). However, multiple input modes can also be integrated within one
hardware device, allowing for richer interaction. A general design
consideration for both unimodal and multimodal input devices concerns users’
involvement. Oviatt distinguishes in this context between active and passive
input modes: “active input modes are ones that are deployed by the user
intentionally as an explicit command to a computer system (e.g., speech).
Passive input modes refer to naturally occurring user behaviour or actions that
are recognized by a computer (e.g., facial expressions, manual gestures). They
involve user input that is unobtrusively and passively monitored, without
requiring any explicit command to a computer”, [Oviatt
2008].
o
Direct vs. indirect control
Category: Input device properties
Reference: [Buxton 1983], [Hinckley 2008], [Jacob 1996]
Direct input devices offer minimal cognitive and physical distances between the
input action and the resulting output. Moving a virtual object on a touch
display is very direct, for example, since the user can directly push the
object with their finger. (1) There is no (noticeable) physical distance
between the finger and the displayed object: the input and output spaces are
identical. (2) There is also no hardware device that could increase the
distance and require additional cognitive and motor effort for its usage. (3)
The input action of the user matches the visual feedback on the display. This
direct touch input, on the other hand, introduces occlusion and precision
problems (see [Vogel & Baudisch 2007] for a detailed discussion), whereas using a mouse does not result
in information being occluded. However (1) the physical distance between the
mouse and the display is larger, (2) the mouse device has to be handled and (3)
also the associated cognitive effort is higher. The application of a mouse in
an environment is not trivial, since the mouse is normally operated on a
horizontal table, but the resulting pointer movement acts on the vertical
display. The learning effort for a mouse is thus much larger as compared to a
more direct input such as a touch display. The directness of input devices
is related to the directness defined by Hutchins et al.
[1985] in the context of direct manipulation
interfaces: “[...] the information processing distance between the user's
intentions and the facilities provided by the machine. Reduction of this
distance makes the interface feel direct by reducing the effort required of the
user to accomplish goals”, [Hutchins et al. 1985].
o
Feedback / output modality
Category: Input device properties
Reference: -
The stimulation of human senses by an input device in response to an input
action is not often considered in the discussions of the design space of input
devices in the literature. We introduce this property since additional feedback
at the origin of input is of critical importance, in addition to the visual
feedback already given on the display. This is obvious when comparing physical
keyboards with virtual on-screen keyboards. A key issue of the latter “is the
lack of tactile feedback of the keys, both vertically (the non-linear
resistance of a key) and laterally (key surface features that prevent the
finger from drifting away)”, [Zhai et al. 2005]. Without the tactile feedback, users are restricted in effectively
writing blind and the interaction performance decreases in general. The ISO
standard [ISO-9241-9: 2000]
also specifies requirements for input devices concerning tactile and kinaesthetic
feedback: Buttons should have a displacement between 0.5 mm and 6 mm and the
displacement force should be within the range of 0.5 N to 1.5 N until
actuation. Thus, the desired feedback of an input device has to be considered
from the very first steps of hardware design. In addition to these more passive
feedback modes, active feedback can also be given by vibrators
(well-known from cell phones), embedded audio or light sources, or
force-exerting mechanical arms providing haptic feedback (e.g., for virtual
environments). However, more unconventional output modes can also be used for
stimulating human smell, balance or heat senses, for example. For the design of
input devices for LHRDs, feedback is particularly important. Due to the limited
field of view, users are not able to view the entire display from all
positions. Additional feedback at the input device can catch the user’s
attention and ensure that a notification or an error message is noticed. LHRDs
are often used by multiple users. An input device with output functionality can
provide user-specific and private feedback. Users can be individually notified
without bothering or irritating other users.
o
Multi-device, multi-user support
Category: Input device properties
Reference: -
There are very few cases in which only one input device is utilized (e.g.,
automated teller machine). In most cases, at least two input devices are used
in combination - the mouse and keyboard. It is not unusual, however, to have
more input devices running. Taking the setting of the author as he writes this
text as an example, the following input devices are ready for input: a laptop
keyboard and an external keyboard (higher comfort), the embedded touchpad
including mouse buttons, a wireless mouse, an embedded camera including a
microphone, and a fingerprint reader (not to mention the passive input devices
such as the light sensor, the accelerometer of the hard drive, and the
display-closing switch). Although not all devices are used in parallel, they
have to be technically designed to allow that. This is not a trivial issue - in
the case of wireless input devices, for example, there are limited frequency
ranges open for use (in Germany these are specified by the Bundesnetzagentur[12]). The
radio modules should therefore be able to handle interference caused by
multiple devices and should provide alternative frequencies and suitable
identification mechanisms. If multiple users are working together, for example
in the context of LHRDs, the input devices should technically and conceptually
support multiple devices and also multiple users interacting simultaneously.
Touch displays should therefore be able to track several fingers in parallel
without technical interference. Even the operating system or the application
software should enable multi-point interaction such as the Multi-Point X Server
of Hutterer & Thomas [2007].
·
Input
Device parameters
The following parameters should be considered for
the design or optimization of an input device. In contrast to the input device
properties, these parameters can be tuned. They have a significant impact on
the functionality and usability of the devices.
o
Resolution
Category: Input device parameters
Reference: [Hinckley 2008], [MacKenzie 1995]
Resolution is the resolving power of a sensor,
basically the smallest incremental change that can be detected in a physical
property such as position, orientation, pressure, temperature, or light
intensity (see input device properties – physical property sensed). However,
one has to keep in mind that sensors can introduce deviations such as
non-linearity at the extremes as well as offsets or gains due to environmental
changes such as varying temperature or air-pressure. The total resolution of an
input device is determined by the resolution of its sensor(s) and the supported
resolution of the associated data processing hardware/software (e.g., precision
and range of the data types and the calculation) and the transmission channel
(e.g., the bit depth). The resolution has a critical impact on interaction
performance since it can limit the achievable accuracy and error rate. A
sufficiently high resolution in the sense of efficient use of resources can be
calculated based on the Shannon sampling theorem [Shannon
1949] with respect to the display resolution. However,
the actual required resolution could be less, depending on the interaction
design (e.g., size of buttons), the application domain (e.g., office work vs.
gaming) and the user group (e.g., experts vs. novice users).
o
Sampling rate
Category: Input device parameters
Reference: [Hinckley 2008], [MacKenzie 1995]
The sampling rate is the number of measurements per unit time of a sensor. In
the case of optical sensors, such as a video camera, the sampling rate is
expressed in frames per second (FPS); for other sensors the general unit of
frequency Hertz (Hz) is used. Since most sensors are “blind” between the
measurements, high sampling rates are desirable in order to catch all changes
of the input device, the human body or the physical environment. However, the
sampling rate is limited by the sensing technology, the computational power and
the transmission bandwidth. If the sampling rate is too low, parts of the
user’s input are not recognized at all and the interaction feels less direct
and less responsive. Low sampling rates limit input accuracy and precision and
can cause increased error rates. The determination of an optimal or a
sufficiently high sampling rate is not trivial, since it depends on the sensing
technology, the physical property to be measured and the velocity of
interaction. Since most displays have a limited refresh rate of 60 Hz, a rule
of thumb for pointing devices is to achieve at least the same rate for
sampling. However, the possibility that fast movements (e.g., writing with a
stylus or tracking finger gestures) may not be detected in sufficient detail is
significant. Moreover, higher sampling rates are beneficial, since the input
and output rates are not synchronized and the time difference between input
measurement and display response causes a lag (see next item). For other
physical properties far higher sampling rates are desirable: in order to
reliably track hand or device gestures with accelerometers or optical systems,
sampling rates of more than 100 measurements per second are essential. For
speech recognition sampling rates on the order of 8 to 16 kHz are required.
Moreover, higher sampling rates also provide the advantage of reducing signal
noise without affecting the responsiveness of the system.
o
Lag
Category: Input device parameters
Reference: [MacKenzie 1995]
Lag is specified as the time delay between input action and output response.
”Any delay in the hand/eye control loop is likely to cause loss of user
performance. A delay of up to 20 ms does not degrade user performance because
it is usually not perceived. A delay of 40 ms results in a 10 % reduction in
user performance and a delay of 100 ms causes a 50 % reduction in user
performance compared with a situation in which no perceptible delay occurs”, [ISO-9241-9: 2000]. The lag of an
interactive system has several sources: First, the sampling rate of the input
device introduces a lag. For example, with a sampling rate of 60 Hz an average
delay of 8.3 milliseconds is introduced (half of the time span between the
measurements). In addition to this lag, additional delays caused by signal
processing, data transmission, and other system related processes are added.
Finally, the refresh rate of the display adds an additional delay similar to
the sampling rate of the input device. However, if the computational and
graphics power of the interactive system is not capable of rendering images
with the same frequency as the technical display refresh rate (e.g., rendering
of high-resolution images), the effective refresh rate is reduced which in turn
further increases the lag of the entire system. Since the lag caused by the
input device is just one part of the total system lag and the other parts are
not controllable by the designer of an input device, the lag introduced by this
device should be minimized to the extent possible.
o
Transfer function
Category: Input device parameters
Reference: [Hinckley 2008], [MacKenzie 1995]
The transfer function describes the relation between the sensor measurement
(e.g., finger position) and the input data forwarded to the operating system
(e.g., pointer position). Dependent on the physical property being sensed and
the sensor technology, either the input data can be directly transferred
(position-to-position) or it has to be converted (e.g., velocity-to-position or
force-to-position). Absolute pointing devices have a 1:1 mapping between
the motor space (where the user interacts) and the display space (where the
virtual pointer is rendered). Relative pointing devices, on the other
hand, need to convert relative movements (or pressure) in motor space to
absolute positions in display space. Here, the incremental movements are added
to the last position in display space. In order to offer faster pointer
movements or more precise pointing the transfer function can be modulated –
this is known as the CD gain (control-display gain). Casiez et al.
discuss this as follows: “If CD gain is 1, the display pointer moves at exactly
the same distance and speed as the control device; when CD gain is greater than
1, the display pointer moves proportionality farther and faster than the control
device; and when CD gain is less than 1, the display pointer moves slower,
covering less distance than the control device”, [Casiez
et al. 2008]. The CD gain is thus a parameter that can
be manipulated to adjust the pointing speed and accuracy to the current needs
of the user. We will discuss the CD gain in chapter 4 (p. 91) more in
detail where we will introduce a new precision enhancing pointing technique
based on this input device parameter.
o
Hardware design
Category: Input device parameters
Reference: -
Although most input device taxonomies ignore the
hardware aspect of an input device, we consider this parameter as critical for
usability and also for the (economic) success of an input device. There are
many factors which affect the hardware design, though we find it necessary to
mention mass, shape, material, and colour as the most relevant. The weight of
an input device can have a great impact on pointing accuracy, but also on the
subjective satisfaction of the user. If the device has to be operated in
mid-air such as a data-glove and it is too “heavy”, its operation requires a
high degree of physical exertion resulting in early fatigue, increased muscle
tremor along with degraded pointing accuracy [Foley et
al. 1984]. However, at least for short-term
interaction, more weight can be beneficial to compensate the natural muscle
tremor resulting in higher pointing accuracy. This is one of several trade-offs
that have to be considered when designing a hardware input device. Moreover,
the shape of an input device has to be customized to the desired handling of
the device (ergonomic shape). The weight distribution should also be
considered. Above all, the shape, the type of material and the colour have to
be selected with the objective of inducing positive emotions and inviting the
user to interact. They should communicate the possible actions the user can
perform with the device. Norman describes this quality of a design with the
term “perceived affordance”; “the actions the user perceives to be possible,” [Norman 1999]. Good hardware design
facilitates understanding of the usage of the device. This can have an enormous
effect on learning time, error rate and frustration of the user. Besides these
design goals, there are also practical aspects such as robustness, easy
maintenance (e.g., battery change) and hygienic issues.
o
Naturalness
Category: Input device parameters
Reference: [Foley et al. 1984]
“Naturalness captures the idea of transfer of activity from other everyday
activities. Pressing the foot to slow down some operation is an example of such
a technique, taking advantage of analogy to activities most people do
regularly, such as using the brake of an automobile.”, [Foley
et al. 1984]. Close relations between activities used
in human-computer interaction and in real-world interaction provide the
advantage of lesser cognitive and physical learning demands placed upon the
user. Instead of learning artificial interaction styles the user can transfer
well-known concepts such as the direct manipulation of physical objects into
the digital world. This can effectively reduce the gulf of execution, the gap
between the user’s goals and the way they must be specified to the system [Hutchins et al. 1985]. A framework that
gives a theoretical approach to the design, exploration and analysis of such reality-based
interaction (this is also the name of the framework) was introduced by Jacob et al. [2008]. This framework helps to
explore diverse reality-based designs based on four themes: naïve physics, body
awareness and skills, environment awareness and skills, and social awareness
and skills. The naturalness of an input device cannot be directly measured;
however the four themes of reality-based interaction enable a more systematic
investigation and may inspire new design alternatives.
o
Motor space / footprint
Category: Input device parameters
Reference: [Card et al. 1991], [Hinckley 2008]
In the literature, the term footprint refers to the amount of space on a desk
the input device requires. Since some input devices are designed to operate in
mid-air and provide the flexibility of interacting in more than two dimensions,
the term footprint needs to be revised. We propose the term motor space, since
this is also used in the context of the transfer function / CD gain describing
the space where the user interacts (as opposed to the display space where the
visual feedback is provided). For absolute pointing devices (1:1 mapping) the
required motor space is identical with the display space. In the case of
relative pointing devices, motor and display space are decoupled. Here, the
required motor space depends on the resolution and sampling rate of the sensor
as well as on the CD Gain and the resolution of the display. Clutching
techniques, e.g., lifting and repositioning of the mouse, can help to virtually
extend the motor space if it is constrained by the physical setting (e.g., a
small desktop) or the user feels uncomfortable moving the device over the full
motor space. In general, the motor space should be large enough to achieve the
needed pointing accuracy, but small enough to efficiently cross the display
with limited physical effort.
o
Mobility
Category: Input device parameters
Reference: -
We defined the input device parameter mobility as the degree of users’ freedom
to vary their location while operating the device. As discussed in chapter 2 (p. 21), users need to physically move in front
of a LHRD in order to fully utilize the provided display resolution. Most input
devices are designed to provide the flexibility to move them within the limited
motor space required for interaction. However few input devices are designed to
enable the user to move while interacting. In contrast to tethered devices, a
wireless mouse can be carried around, but it needs a stable surface for proper
operation that restricts the mobility of the device. A gyration mouse can be
operated in mid-air and it thus provides more mobility, however it still
requires carrying the device. A touch display requires no additional hardware
device, but restricts the user in the interaction distance to the display. More
flexibility is provided by optical tracking systems that track finger- or
hand-gestures without any device. However, the space covered by the cameras is
technically restricted. Thus, depending on the particular mobility requirements
of the user, an appropriate device design, sensing and data transmission
technology has to be chosen. There is also a more conceptual aspect of mobility
that should be considered. [Vogel & Balakrishnan
2005] specified the requirement of a “smooth
transition between interaction distances: The pointing device should
smoothly transition from up close interaction, to interaction at a distance
from the display. This implies that the way in which the device is operated
should be consistent regardless of its distance from the display,” [Vogel & Balakrishnan 2005]. If users
change their position, their interaction tasks may also change with distance or
orientation to the display. A user wants to scribble directly on the screen and
afterwards she overviews and saves the sketch from a distant position with the
same input device, for example. Although the location and the tasks are
changing, the interaction concept should be consistent.
·
Usability
measures
o
Effectiveness
“Measures of effectiveness relate the goals or
subgoals of the user to the accuracy and completeness with which these goals
can be achieved”, [ISO-9241-11: 1998].
§
Pointing accuracy
Category: Usability measures – Effectiveness
Reference: [Card et al. 1991], [Hinckley 2008]
[Card et al. 1991] defined
pointing precision as the size of a target that can conveniently be selected
with the input device. In the context of human-computer interaction, the terms
accuracy and precision are mostly used synonymously for the extent to which a
target can be hit (selected or just pointed at) with an input device. However,
in physics and engineering there is a clear difference in their meaning:
accuracy describes the deviation of a measured value from the actual (true)
value. Precision describes the deviation of the measured values from each other
(independently of the true value). If the user has the goal of hitting a target
with an input device, the accuracy gives information about the ability to
really hit the target (proximity) and the precision provides information about
the ability to hit the same point multiple times (repeatability). It is obvious
that both high accuracy and precision are desirable. For the sake of clarity
and following the nomenclature of the [ISO-9241-11:
1998], we have decided to use the term pointing
accuracy for the classification that subsumes accuracy and precision with the
focus on the user goal – hitting a target. In order to investigate pointing
accuracy, a variety of empirical tests can be used. [Myers
et al. 2002] applied a dwelling task where users were
asked to aim with the input device at a target as steadily as possible for a
certain time (three seconds). The deviation was determined by averaging the
Euclidean distance from the target. The [ISO-9241-9:
2000] proposes to use one-directional or
multi-directional tapping tasks where the users are asked to point and select
diverse targets subsequently which are varied in their size and their distance
to each other. Based on Fitts’ Law [Fitts 1954] – a psychological model for human motor behaviour – the throughput
of an input device can be calculated (index of performance). The throughput
integrates pointing accuracy and pointing speed into one measure that can be
used to compare several input devices. A factor of throughput is the effective
target width that corresponds to the pointing accuracy. It describes the
width of the distribution of coordinates selected by a user during a tapping
test. See [Soukoreff & MacKenzie 2004] for a detailed discussion.
§
Error rate
Category: Usability measures – Effectiveness
Reference: [Card et al. 1991], [Hinckley 2008], [MacKenzie 1995]
The error rate is a very common and simple measure for effectiveness in terms
of completeness. It describes the percentage of errors: the number of errors
divided by the total number of actions. The definition of an error depends on
the task. Using a tapping task, an error is counted whenever the user hits
outside the target boundary. The error rate is therefore dependent on the size
of a target. The error rate a user can achieve with an input device is only
comparable with other devices if the experimental settings are comparable such
as the size of the targets, their positions and the interaction distances. The
error rate gives less information than pointing accuracy, since it simply
counts whether or not the target was hit. It does not account for the absolute
pointing accuracy: if the user hit directly at the centre of the display or
almost at the boundary. However, this simplification matches the actual usage
of pointing devices and current interface paradigms: a button is activated if
it was selected (simple binary decision). The interface designer wants to know
the pointing accuracy in order to optimize the button size – but for users the
error rate is an obvious indicator for the effectiveness they can achieve with
a specific input device.
§
Effective motor space
Category: Usability measures – Effectiveness
Reference: -
We introduce the measure effective motor space that describes the actual usage
of the available motor space for interaction. Although the input device
parameter motor space (footprint) predefines the theoretically required
interaction space, the individual usage by different users for different tasks
and in different environments can vary greatly. The real usage of all areas of
a touch-sensitive wall display depends on, for example, the height of the user,
the user interface design, social protocols, and group dynamics. Although the
motor space covers several square meters, only a small part may be utilized.
This insight may introduce further requirements such as the accessibility of
distant objects from a central position or the redesign of the user interface
layout. The effective motor space can be measured by tracking movements in
motor space (e.g., hand movement) and constructing the outer boundary e.g., as
a cube or a three-dimensional convex hull based on the tracked input samples.
§
Effective mobility
Category: Usability measures – Effectiveness
Reference: -
Similar to the previous measure, the extent of users’ bodily movement is also
greatly dependent on the particular usage context. Ball
et al. [2007] measured the actual physical navigation
of users interacting with displays of different size and resolution. An
interesting research aspect in this context is the relation between the
effective motor space and the effective mobility. The latter can be measured
and expressed in a manner similar to the effective motor space with tracking
systems and the construction of the three-dimensional motion boundary. For the
effective mobility, however, the location of the user is measured, in contrast
to effective motor space for which the location of the acting human limb or the
controlled input device is of interest. A hypothesis may be that the effective
motor space and the effective mobility correlate negatively to each other. In
order to investigate such correlations we introduced the measure effective
mobility as the extent of users’ motion in space.
o
Efficiency
“Measures of efficiency relate the level of
effectiveness achieved to the expenditure of resources. Relevant resources can
include mental or physical effort, time, materials or financial cost”, [ISO-9241-11: 1998].
§
Pointing speed
Category: Usability measures – Efficiency
Reference: [Card et al. 1991], [Hinckley 2008]
Pointing speed reflects the time needed to complete a pointing task with a
particular input device. In tapping tasks in which a task is achieved when the
target is selected, the pointing speed combines the movement time and
the selection time per task. The [ISO-9241-9:
2000] defines the movement time as follows: “time to
move a pointing device from a start position to a target position excluding
stimulus presentation time and button actuation time.” The more general term
for button actuation time is the selection time that describes the time
required to select the target, for example, by clicking a physical button.
Practically, it is hard to distinguish between these two time spans, since they
may be partially concurrent and depend on each other. Therefore, the movement
time, used for calculating the throughput of an input device based on Fitts’
Law, also includes the selection time by convention. Considering the ecological
validity the combination of both is reasonable, since most tasks in
conventional graphical user interfaces (e.g., based on the WIMP[13]
interface paradigm) require the positioning of a pointer followed by the
selection of an active area (e.g., a virtual button). Since pointing speed is
defined relative to a particular task, the more comparable performance measure
is the throughput (index of performance) that is a composite measure based on
pointing speed and pointing accuracy.
§
Learning time
Category: Usability measures – Efficiency
Reference: [Card et al. 1991], [Foley et al. 1984], [Hinckley 2008]
[Card et al. 1991] defines the
measure learning time as “the amount of practice required before a user is
proficient with a device”, [Card et al. 1991]. [Foley et al. 1984] differentiate learning time further: “Cognitive learning time is
the time it takes to learn to use the technique to achieve the desired effect,
while motor learning time is the time it takes to achieve the necessary
physical skill to carry out the action”, [Foley et al.
1984]. The learning time gives information about the
ease of learning to use an input device and its naturalness. For comparing different
input devices it is critical to ensure that learning effects are stabilised by
an appropriate training. Since learning usually follows a power function, the
learning level can be determined by analyzing users’ performance improvement
over time [Card et al. 1987].
At the beginning, users learn at a higher rate while the curve levels out over
time. The [ISO-9241-9: 2000]
proposes that “each subject should be allowed to learn the use of the input
device until speed and accuracy do not show any significant improvements”, [ISO-9241-9: 2000]. When testing new input
devices the cognitive and motor learning may last too long for a conventional
cross-sectional study. Here, longitudinal evaluation approaches offer more
potential for valid measurements [Gerken et al. 2009].
§
Device acquisition time
Category: Usability measures – Efficiency
Reference: [Card et al. 1991], [Hinckley 2008]
The device acquisition time specifies the time users require to get ready for
interaction. If a physical pointing device is used, this is the time effort
associated with grasping the device and locating the pointer on the screen. For
input modes without a mechanical intermediary such as freehand pointing, users
also need time to get ready, for example, by performing the desired pointing
gesture and gearing towards the display. In various cases users switch between
specialized input devices to carry out tasks, for example, writing a text with
the keyboard and formatting the text with the mouse. If the total input
performance is important, the accumulated device acquisition time increased by
each switch may result in a significant overhead. This issue can be addressed
by integrating the required input devices into a composite device such as the
Touch&Type technique of Fallot-Burghardt et al. [2006]. They reduced the total device acquisition time by enabling
touch-input on the surface of each key button of a conventional keyboard
forming a large touch pad. Thus the user could control the pointer by sliding
over the keys augmenting the conventional input capabilities of a standard
keyboard. The physical distance between the pointing and text input is thus
effectively reduced resulting in lower time overhead. A similar solution is
well-known from IBM laptops: the embedding of an isometric joystick in the
centre of a keyboard (e.g., IBM pointing stick).
§
Effort (perceptual, cognitive, motor)
Category: Usability measures – Efficiency
Reference: [Foley et al. 1984], [Hinckley 2008], [MacKenzie 1995]
The effort reflects the extent to which perceptual and cognitive demands are
placed on users and the physical exertion required in order to complete a task.
High effort on one or all of these three distinct layers – perception,
cognition and action – introduces fatigue and thus may have an effect on users’
satisfaction and the resulting interaction performance. Visual and auditory
clutter may lead to perceptual fatigue, whereas the cognitive form of fatigue
can be caused by unrealistic memory loads, displeasing stimuli and uncertainty [Foley et al. 1984]. Input devices that
require excessive muscular strength or an inappropriate working posture can
cause motor fatigue. The motor effort can be assessed using the Borg Scale [Borg 1970] that quantifies “subjective
opinions about the level of effort a given input device (or task) requires”, [ISO-9241-9: 2000]. An overall workload
score can be determined by the NASA-TLX (Task Load Index) which allows
subjective workload assessments based on a multi-dimensional rating procedure
to be performed [Hart & Staveland 1988].
o
Satisfaction / user experience
“Satisfaction measures the extent to which users
are free from discomfort, and their attitudes towards the use of the product”, [ISO-9241-11: 1998].
§
satisfying, pleasurable, engaging,
entertaining, challenging, frustrating, annoying,...
Category: Usability measures – Satisfaction /
user experience
Reference: [Card et al. 1991], [Foley et al. 1984], [MacKenzie 1995]
“Satisfaction can be specified and measured by
subjective rating on scales such as discomfort experienced, liking for the
product, satisfaction with product use, or acceptability of the workload when
carrying out different tasks, or the extent to which particular usability
objectives (such as efficiency or learnability) have been met”, [ISO-9241-11: 1998]. In addition to the
assessment of effort, the NASA-TLX can also be used to quantify subjective
ratings concerning frustration and perceived performance. An instrument for
investigating satisfaction and user experience in particular is the AttrakDiff
questionnaire [Hassenzahl et al. 2003]. AttrakDiff assesses pragmatic and hedonic qualities of an
interactive product (e.g. an input device) based on a set of opposite
adjectives that users have to rate. A very abstract but strong measure for
satisfaction and user experience is the user preference that can be assessed in
comparative evaluation studies. Here, users state their preference for a
specific device after using different alternatives directly in comparison.
This classification illustrates the diverse dimensions forming the design space of input devices. We developed this theoretical contribution by integrating the essential ideas of various very specific taxonomies (see listed references for each item) and measures in a consistent and comprehensive framework. Moreover, the existing taxonomies did not consider the requirements and possibilities of uncommon environments such as LHRDs. We therefore complement the classification with the dimensions feedback/output modality, multi-device, multi-user support, hardware design, mobility, and the measures effective motor space and effective mobility. The classification is intended to support the informed design, the systematic description, and the methodical evaluation of input devices. Based on this classification, designers are able to systemically explore diverse alternative designs along the dimensions of the design space. They may document their design decisions and describe the resulting solution based on this theoretical groundwork (such as shown in section 3.3.3.3, p. 81). Furthermore, the usability measures show the connection between the design and the resulting quality of use – also beyond times and errors. In the case of interacting with LHRDs, high effective mobility of the input device, for example, can be even more important for the user than efficient usage. LHRDs are often used for presentation environments in which the flexibility to move in front of the display without physical restrictions caused by the input technology can be essential. In order to stimulate reflection on these different usability measures we directly included the measures within the classification as an integral part of the design space.
In the next sections we will introduce an input device – an interactive laser pointer – which is especially designed to meet the requirements of users interacting with LHRDs. This input device and the classification were developed in parallel. In doing so, both profited mutually and were iteratively improved. We will discuss the software and hardware design of the interactive laser pointer in the following using the classification as a theoretical foundation. In section 3.3.3.3 (p. 81) we will describe the final design of the interactive laser pointer explicitly in terms of the design space classification. In using this formal categorization, we provide a clear, comprehensive, and comparable specification of the input device which serves as an example and springboard for further internal and external work.
3.3 Laser Pointer Interaction
Thanks to the increased display resolution and large dimensions of LHRDs compared to conventional desktop displays, they offer great opportunities for various industrial and scientific application domains. They are capable of visualizing large and complex information spaces without sacrificing context or detail. LHRDs are therefore widely used for exploration and analysis tasks, whereby one user or a group of users observe detailed information at close range or obtain an overview of the displayed information space from a distant position. As discussed in section 2.3 (p. 31), users are not able to perceive both detail and overview perspectives simultaneously, since the display capabilities exceed either the limited human visual acuity or the users' field of view, dependent on their distance from the screen. It therefore follows that the ability to move around freely while interacting with the display is an absolute requirement for input devices. Traditional input devices such as the mouse and keyboard are technically unable to fulfil this requirement since they require a stable surface for their proper operation. Wireless air mice with integrated gyroscope, or presentation aids with additional mini joystick or trackball offer more mobility but perform substantially worse than a traditional mouse [MacKenzie & Jusoh 2001]. Due to their relative interaction mode, they are also less suitable for supporting handwritten annotations and drawings.
We therefore propose laser pointer interaction as a more usable interaction technique for large, high-resolution displays because of the flexibility offered and the direct and intuitive manner of interaction. The well-known laser pointer is thus used not merely as a presentation aid for accentuation purposes, but is additionally used to control the cursor, or more generally, the entire user interface. Users typically utilize a laser pointer as a natural extension of their hand, so the cognitive load for interaction is imperceptibly low since pointing is a fundamental human gesture. The mental association of physical laser pointer and virtual cursor movement is easy and is processed subconsciously. In contrast, the use of a conventional mouse is – at least in the beginning – more demanding, since physical and virtual movement take place in different planes (horizontal surface vs. vertical display) and with different speed levels due to the mouse acceleration that is applied.
Mobility is a fundamental requirement for input devices that are to be used with LHRDs, and it is satisfied by an interactive laser pointer, since it is the reflection of the laser on the display that is tracked and not the position of the laser device itself. Thanks to the low-divergence light emission of the laser beam, the user can interact from almost any position and distance on the LHRD. Whether the user writes directly on the display or is pointing to an object from afar, there is no need to change the input device or the interaction technique. Other vision based tracking systems such as infrared marker tracking are limited in their tracking space, since the position and orientation of the input device is measured directly with a limited number of cameras. Moreover, the tracking target, consisting of multiple markers which are arranged uniquely, are obtrusive and restrict the hardware design of the input device in terms of shape, size, and weight.

Figure 17: Newsmap visualization[14] on the Powerwall at the University of Konstanz controlled with the first version of our interactive laser pointer [König, Bieg & Reiterer 2007].
Interactive laser pointers are already used to some extent for presentation scenarios with a single low-resolution projector or multi-projection systems. However, LHRDs such as the Powerwall at the University of Konstanz (see Figure 17) with a display size of over 220 inches and a resolution of almost 9 megapixels poses as yet unknown challenges in the areas of tracking precision, speed, and interaction technique in general.
In this section we present a flexible and scalable interaction toolkit that allows absolute and almost delay-free input in the form of laser pointer interaction. Besides offering an intuitive interaction technique, and in contrast to previous research, we concentrate especially on satisfying the requirements of usage with large, high-resolution displays particularly concerning mobility, accuracy, interaction speed, and scalability. Subpixel-accurate tracking methods and the possibility of combing any number of cameras to increase overall resolution facilitate high technical accuracy. Furthermore, we apply a combination of dynamic and static Kalman filters in order to compensate for natural hand tremor in real time. In particular, we propose the use of an interactive laser pointer with an infrared laser diode (see Figure 17), which allows interaction without visible reflection on the display. In this way, no displayed information is overlapped by the laser reflection, and the style of the cursor (the visual feedback) can be changed in a very flexible manner. We compared our interactive laser pointer with a conventional mouse in a controlled experiment on the basis of the ISO standard 9241-9. The 16 participants performed unidirectional tapping tasks with varying distances on the Powerwall in the University of Konstanz. Before we describe the evaluation study in more detail, relevant prior research is discussed in the following section. Subsequently, more detailed information about our laser pointer interaction toolkit and the developed hardware input devices is provided.
3.3.1 Related Work
In recent years, laser pointers have been widely used as presentation aids and have been integrated in remote controls, USB sticks, pens, and various other common devices. It has thus become a well-known device, and the idea of additionally using it as an input device dates back to the end of the 1990s.
In 1998, Kirstein & Mueller [1998] presented a video-based tracking system that was able to detect a single laser point on a projection surface. Although their hit rate of 50% was rather low, the basic idea seemed promising. They also proposed dwelling as an interaction technique for laser pointers; an action is triggered whenever the user keeps the laser reflection in an active area for a defined time. Olsen & Nielsen [2001] introduced enhanced actions with dwelling and the laser state, depending on the currently focused UI-widget. They also compared a conventional mouse with their tracking system in an evaluation with eight participants. The movement time (MT) with the laser pointer was more than twice as long as the measured MT of the standard mouse. Clearly, the low frame rate of 7 fps (frames per second) and the remarkable delay of approximately 200 ms had a noticeable effect on the evaluation results. Chen & Davis [2001] combined eight interlinked cameras to track laser reflections on a back-projection system named “Interactive Mural” with a display area of 1.8 x 0.6 meters and a resolution of 3796 x 1436 pixels. They detected multiple laser pointers in parallel with an interlaced frame rate of 60 Hz and distinguished different strokes by separate Kalman filters. Likewise, Ahlborn et al. [2005] also focused mainly on the practical issues of laser pointer tracking and described a robust and efficient dot detection method.
Empirical Studies
Cavens et al. [2002] compared a laser pointer emitting red light with a traditional mouse, and in a further study they compared the red laser pointer with one emitting invisible infrared light. The mouse and red laser pointer showed similarly good movement times, whereas the infrared laser pointer performed significantly worse. Only four and six persons respectively participated in these studies; in view of these small numbers and the remarkable tracking delay, the results should be interpreted carefully. In a study with 10 participants, Peck [2001] examined usage parameters for the design of laser pointer interaction techniques and found that a user needs between 0.9 and 1.4 seconds to acquire a target after turning on the laser. Furthermore, an additional time of at least one second is required to determine a dwell on a target. Peck also showed that the dwell area, and therefore the jittering, measures about 0.4° vertically and between 0.4° and 0.6° horizontally depending on the distance to screen. In a comparable evaluation, Myers et al. [2002] showed that, in contrast to Peck, the jittering is horizontally stable but vertically distance-dependent. In a second experiment, Myers et al. compared a traditional mouse with a laser pointer and a touch-sensitive SmartBoard. As expected, the direct interaction on the SmartBoard led to a significantly better performance rate with 11.80 Bits/s (index of performance in bits per second according to ISO 9241-9), followed by the mouse with 6.98 Bits/s and the laser pointer with 5.08 Bits/s [Myers et al. 2002]. Oh & Stuerzlinger [2002] presented a similar result. They also compared a mouse with a visible laser pointer and identified an index of performance of 3.98 Bits/s for the mouse and 3.04 Bits/s for the laser pointer. Since their authors used different calculation methods, the absolute performance values of these two studies are not directly comparable. Nevertheless, a relative performance advantage of at least 30% for the mouse versus the laser pointer is generally observable.
The cited studies and systems were employed in conjunction with conventional projection screens (e.g., 1.8 x 1.2 m, [Oh & Stuerzlinger 2002]) with small amplitudes (distance between targets: e.g., 60 cm, [Myers et al. 2002]) and short distances to display (e.g., 1.5 m, [Myers et al. 2002]). Whether or not these empirical findings were also transferable to large, high-resolution displays such as the Powerwall at the University of Konstanz, with its display area of 5.20 x 2.15 m and resolution of 4640 x 1920 pixels was a driving question in our research. Here, the distance between targets can amount to more than 5 meters and users are not always able to survey the entire display because of their limited field of view. Hence, users have to turn their heads to switch between targets. To answer this question, a formal evaluation was undertaken and is described in section 3.3.4 (p. 83). First, however, we describe our laser pointer interaction toolkit as well as the developed hardware input device which we used as test environment for the controlled experiment.
3.3.2 Requirements & Features
Although some research regarding laser pointer interaction has already been carried out in the past few years, so far there has been no reference system that combines the individual and very specific solutions of different works in one flexible yet robust software toolkit. The laser pointer interaction toolkit introduced here represents such a combination and, in addition, claims to be especially suited to interaction with large, high-resolution displays. Moreover, the much larger display size of LHRDs, the higher resolution as well as the users' mobility and their typical behaviour also have to be considered. To achieve an adequately high tracking resolution, our toolkit allows the interlinking of any number of cameras in a flexible client-server architecture and therefore scales almost linearly. As well as increasing the overall resolution, the interaction precision is enhanced by applying sub-pixel accurate tracking algorithms and a combination of static and dynamic Kalman filters. We were therefore able to compensate for natural hand tremor and the associated jittering of the cursor.
Further main issues relating to our laser pointer interaction, are minimizing the interaction lag and supporting high interaction speed. With increasing distance from the display, even small laser pointer movements of only a few degrees already cause rapid cursor motion. To control that extremely responsive cursor effectively, users need an instant and correct visual feedback of their interaction. By the use of industrial cameras and optimized detection algorithms, we can track the laser with a frame rate of over 80 fps and a tracking and transmission delay of less than 10 ms in total. The result is that users receive a natural and direct feeling of interaction and high interaction performance.
Technically, the cameras are positioned behind (back-projection) or in front of the display in such a way that each camera looks onto a particular, predefined area of the display, and in combination they cover the entire screen. Automatic calibration allows the cameras to be freely positioned either in the centre of, or at an angle to, the specified display area. In addition to the camera’s extrinsic parameters, which derive from the display segmentation and the camera alignment, intrinsic parameters such as radial and tangential distortion are also acquired through the calibration. If the environment is stable, it is sufficient to calibrate the system once and thereafter to simply load the parameters determined earlier.
A further feature of our laser pointer interaction toolkit is the support for visible (red, green, blue) and infrared laser-rays. Existing systems work in the main with red laser pointers, in which only the laser point or the laser point in addition to the cursor is visible on the display. In consequence of tracking delay and inaccuracy, laser point and cursor neither act identically nor match exactly and these facts can irritate the user. We propose the primary use of infrared laser pointers. Infrared rays are not visible to the human eye and therefore allow visualization of just the virtual pointer, which can also be varied according to the system’s state, thus matching the user’s expectations. Moreover, in the case of a visible laser the natural trembling of the user's hand is clearly evident to everyone, for instance, the audience in a presentation situation. When using an infrared laser, the laser pointer trembles but is invisible while the jitter compensation reduces the trembling of the visible cursor. So the pointer remains largely steady even in situations with a higher stress level.
3.3.3 Design & Development
Within the seminar “Interaction Techniques for High-Resolution Displays” in summer term 2006 a first feasibility study of an interactive laser pointer was conducted by Sebastian Rexhausen [Rexhausen & Gerken 2006] under the supervision of and in cooperation with the author of this thesis. The resulting prototypic installation used a conventional red laser pointer as pointing device and four low-cost Logitech USB-cameras for optical tracking (640 x 480 pixels resolution). In order to evaluate the feasibility of this prototype in combination with LHRDs, it was installed at the Powerwall of the University of Konstanz. The prototype offered the possibility to move the virtual pointer of the operating system, however the interaction lag was high and speed was very low with a maximum tracking rate of 30 frames per second. If the laser pointer was moved faster, the cameras lost track of the reflection resulting in missing movements. Moreover the positioning of the cameras and the calibration of the system took more than two hours, since the tracking areas of the cameras needed a defined overlap and the cameras had to be positioned precisely in orthogonal to the projection surface. Nevertheless, there was a certain inaccuracy of up to 10 cm between the actual position of the reflection and the tracked position. This was caused by the focal distortion of the camera lenses, the inaccurate camera orientation and the low resolution of the cameras. However the interaction concept was promising and showed great potential for further improvement.
Based on these experiences, we derived several technical requirements for laser pointer interaction, in particular for use with LHRDs: robustness, scalability, responsiveness, speed, accuracy, and flexibility. We addressed these requirements (discussed below) in an iterative development which was driven by practical usage experiences gained during various demonstrations, presentations, and exhibitions over a time period of almost three years. Furthermore the conducted experiments informed the design of the interactive laser pointer and helped to identify usability flaws and potential for improvement. Up to now, four functional hardware devices have been developed as well as multitudinous software versions which finally resulted in a software toolkit named SquidyVision which is an essential component of the Squidy Interaction Library discussed in section 5.2 (p. 120). SquidyVision is not limited to laser pointer interaction; it also supports the tracking of finger positions on multitouch surfaces. Thus, we could successfully apply the developed techniques and gained insights to a wider field of application domains – relevant also for its commercial use. The multitouch table of the ICT AG Kohlberg[15], is sold with SquidyVision for the optical tracking of finger positions. Since November 2009, SquidyVision has been free software and published as part of the Squidy Interaction Library under the GNU Lesser General Public License[16] (LGPL).
3.3.3.1 Technical Requirements and Solutions
·
Robustness:
The tracking robustness is a critical aspect for
optical tracking systems in general. This includes the accurate identification
of a target and keeping it tracked as long as it is available. In order to
reduce potential disturbing factors and due to usability reasons we decided to
utilize infrared laser diodes (785 nm) as light sources and industrial cameras
which are also sensitive to near infrared light. The cameras were further
equipped with daylight cut filters which effectively reduce light intensity
below 750 nm. Since projectors, sun light, and warm-light bulbs also emit
infrared light, we developed a compensation algorithm which reduces the
measured light intensity of all steady or very slow moving sources (e.g., the
rising sun). This dynamic heuristic is based on the assumption that a user
cannot keep the laser pointer completely steady due to the natural hand tremor.
The jittering and the normal pointing behaviour of the user help to
discriminate between disturbing light sources and the interactive laser
pointer. This technique is extremely important for the robust tracking of our
interactive laser pointer, since we use a class 1 laser diode that emits
infrared light with an intensity of only 0.55 mW. Due to the low radiance
intensity, the infrared laser pointer is, in contrast to commonly used class 3
red laser pointers (mostly 5 mW), absolutely harmless to the human eye and can
be used in public areas without any safety concerns.
·
Scalability:
In order to provide laser pointer interaction on LHRDs, a single camera system
is insufficient for two reasons. First, even if using a wide angle lens, the
camera needs to be positioned at a great distance from the display in order to
cover the entire LHRD (e.g., wall sized-display). Second, a single camera is
limited in its resolution and this restricts the accuracy of the interactive
laser pointer. If the resolution of the camera is multiple times lower than the
resolution of the display, it is difficult or practically impossible to hit a
small object such as the Windows Start button or the closing cross button. In
this case, the pointer cannot be moved smoothly but it visibly skips multiple
display pixels. This imprecision can be partially compensated by interaction
techniques such as Adaptive Pointing introduced in section 4.2 (p. 96). However, in order to provide high
resolution optical tracking, multiple cameras have to be combined in a defined
array covering collectively the entire LHRD. We developed a network-based
client-server architecture that enabled us to plug-in multiple cameras to the
same computer, or alternatively to several independent computers connected via
Ethernet connections. Each camera is driven by an individual client that
processes the video stream, identifies one or multiple laser pointer
reflections, and sends the position data to the server. Just communicating
abstract data (in contrast to the full video stream) effectively reduces the
needed network bandwidth and keeps the computing load at the connected clients.
Thanks to this distributed computing approach our solutions scale very well
with the number of cameras and therefore enables high-precision optical
tracking on LHRDs.
·
Responsiveness & Speed:
The responsiveness of the tracking system and the achievable interaction speed
have great impact on the efficiency of users hand-eye coordination and thus
also on user performance in general. The importance of a preferably delay-free
tracking process is corroborated by MacKenzie & Ware [1993], who have
determined a direct correlation between the measured performance of a device
and the interaction delay – the time between input action and output response.
It turned out that the negative influence on performance was negligibly small
for delays below 25 ms. Taking this lag as an upper limit, we calculated the
desired camera features for the case of applying laser pointer interaction to
the Powerwall of the University of Konstanz (which is also the experimental
setting for the comparative study discussed in section 3.3.4, p. 83): Starting
with an average delay of 8.3 ms as a result of the display rate (60 Hz), and a
maximum image computation and data transmission time of 10 ms (measured in our
case), the camera’s refresh rate should not cause a delay of more than 6.7 ms
on average in order to stay below 25 ms for the total system (8.3+10+6.7 = 25).
To satisfy this requirement, we used three identical industrial USB-cameras
(model IDS 1540-C, cost about EUR 650) with 80 fps (6.25 ms average delay) at a
resolution of 640 x 512 pixels and a 4.8 mm wide-angle-lens. These cameras were
positioned vertically centred behind the Powerwall, each covering 1/3 of the
display. Recently, we were able to further reduce the interaction lag and
increase the achievable pointing speed with SquidyVision by utilizing the
graphics processing unit (GPU) instead of the central processing unit (CPU) for
image analysis. The GPU enables efficient parallel processing based on NVIDIA’s
parallel computing architecture CUDA[17].
Moreover we have been since able to replace the USB-cameras with high-bandwidth
cameras (IDS GigE UI-5460HE) based on gigabit Ethernet. The higher bandwidth
of gigabit Ethernet (1 Gbit/s) compared to USB 2.0 (480 Mbit/s) enables us to
increase the tracking frequency up to 120 frames per second (with a image
resolution of 640 x 480 pixels) which assures also that very rapid movements
and quick contacts are recognized and interpreted by the system.
·
Accuracy:
Thanks to the scalability of the system multiple cameras can be used in
parallel in order to keep an optimal ratio between display resolution and
tracking resolution (sum of all camera resolutions if arranged without
overlap). In the case of the laser pointer interaction (about 1530 x 640 pixels
tracking resolution) at the Powerwall of the University of Konstanz (4640 x
1920 pixels display resolution) we had a ratio of about 1:3 which limits the
pointing accuracy to three display pixels. This ratio is far from being optimal
in terms of the Shannon sampling theorem [Shannon 1949], however we decided to keep
the number of cameras and their costs low, while focusing on software-based
improvements of the pointing accuracy. Instead of interpreting the brightest
pixel of the current camera image as laser pointer reflection (if it is
brighter than a predefined threshold), we used a sub-pixel accurate blob
detection based on [Oh & Stuerzlinger 2002]. Here, bright areas (blobs) are identified and their centre is
calculated by weighting the intensity values. In this way, the position of this
centre is not limited by the camera’s resolution, thus improving the total
accuracy. However, this improvement is practically only valuable if the laser
reflection and its representation on the camera image are larger than a camera
pixel. Thus, larger laser diameters can improve the accuracy when applying
sub-pixel accurate blob detection algorithms. The tracking accuracy could be
further improved by using more cameras; however users are unable to hold the
laser pointer steady because of natural hand tremor. Peck [2001] identified an average deviation
of 0.4° while remaining on one point for 3 seconds. Applying this data to the
Powerwall, users would find it difficult to hit targets smaller than 18 pixels
(2.09 cm) in height and width. This limitation would seriously impair the use
of laser pointers for LHRDs, whose main application is the visualization of
complex information spaces. For this reason we increased the interaction
accuracy by compensating for the jittering with a multi-model Kalman filter [Kalman 1960]. The Kalman filter models
behaviour and predicts the next position based on previously measured
deviations and movement speed. This prediction is compared with the measured
data resulting in an iterative update of the movement model. This enabled us to
reduce both human-caused and technically caused noise. In order to support fast
movements as well as precise hovering, a static, dynamic or weighted
combination of both is used for the prediction based on a multi-model approach.
For the cursor’s final position, our laser pointer interaction toolkit does not
use the measured coordinates but rather the smoothed predictions; this enables
steady hovering in one position as well as smooth movements with different
speeds. This configuration was evaluated in the comparative evaluation study
discussed in section 3.3.4 (p. 83). In response to the results of this
study, the pointing accuracy was further improved by applying the Adaptive
Pointing interaction technique introduced in section 4.2 (p. 96). Thus we
applied improvements on several layers: on the hardware layer by using multiple
cameras; on the image processing layer by using sub-pixel accurate algorithms;
and on the interaction technique layer by using Adaptive Pointing.
·
Flexibility:
In our first feasibility study it took more than two hours to position the
tracking cameras and to calibrate the interaction space. Addition, even a well
calibrated system had an inaccuracy of up to 10 cm. In order to minimize the
setup time as well as this inaccuracy, we developed a mainly automatic
calibration method which reduced the calibration time to a few minutes
(dependent on the number of utilized cameras). Moreover the calibration method
also accounts for the focal distortion caused by the lenses (intrinsic camera
parameters) and trapezoid distortion which is introduced if the camera is not
precisely facing the tracking surface orthogonally (extrinsic camera
parameters). During the calibration process, the cameras' positioning relative
to the display and the corresponding tracking areas are determined
automatically by sequentially visualizing a regular pattern (similar to a
checkerboard) on each display segment (see Figure 19, left). The calibration algorithm determines the positions of all
corner points of the white and black squares and matches them to the display
coordinates. For this purpose we utilize state-of-the-art methods for corner
point detection which are provided by the OpenCV[18] computer
vision library. The number of displayed corner points is adjustable in order to
also enable high precision tracking for curved displays. In this case the
curvature of the display is measured with a fine mesh of hundreds of corner
points. The granularity is only limited by the display resolution and the
resolution of the tracking cameras. This calibration method gave us the
flexibility to apply our laser pointer interaction to very different displays:
the planar Powerwall of the University of Konstanz, the cascaded
rear-projection cubes at the Media Room[19]
of the Human-Computer Interaction Group, the 360° PanoramaScreen[20] of the
ZKM | Center of Art and Media in Karlsruhe, and a conventional front-projection
screen in a conference room in the Canary Islands (see Figure
18 and Figure 19). Although these displays differ in their size, resolution,
projection direction, and curvature, the laser pointer interaction could be
applied uniformly across them all. After calibrating the particular setting,
the parameters are saved in a configuration file which is automatically loaded
at the next start enabling a fast start-up procedure.


Figure 18: Laser pointer interaction at the large, high-resolution Powerwall of the University of Konstanz (left) and at the Cube Wall at the Media Room (right) consisting of two individual rear-projection displays each equipped with an infrared sensitive camera for optical tracking.


Figure 19: Left: Calibration of the tracking area on the 360° high-resolution PanoramaScreen of the ZKM Karlsruhe. Right: Demonstration of the laser pointer interaction and the artistic installation “Globorama” at the 13th International Conference on Intelligent User Interfaces [König et al. 2008].
3.3.3.2 Hardware Design
So far, we have described the tracking system and corresponding aspects of the laser pointer interaction. However, the actual user interface for the end user is the hardware device. Therefore, the ergonomic design of the device, the provided interaction functionality and the perceived affordance stimulated by the device are major critical aspects for interaction quality and performance. We iteratively developed and tested several versions of the device which are described in the following paragraphs. Thereafter, we will discuss the final design along with the design space classification introduced in section 3.2 (p. 41).
Version 1
The basic idea underlying laser pointer interaction is to use the well-known laser pointer for controlling an interactive display. Besides tracking the reflection of the laser ray at the display surface for controlling the virtual pointer, the user needs additional degrees of freedom in order to control conventional WIMP applications such as for selecting an object or for activating a button. Since LHRDs are special environments which are used in addition to and less as replacement for traditional desktop work environments, the interaction techniques utilized on LHRDs should either be very intuitive or at least similar to the desktop interaction techniques users perform daily, in order to minimize learning time and to reduce usage errors. This is of particular importance, since LHRDs are often used in presentation environments in which users show higher stress levels for several reasons, e.g. due to their prominent role as presenter and the focused attention. Thus, the cognitive load caused by the interaction with LHRDs should be kept minimal. We therefore considered an infrared laser pointer with physical buttons as a good starting point for studying the hardware design and the laser pointer interaction in general. There are also more uncommon interaction techniques developed mainly for pen input which replace button-clicks by predefined pen gestures [Hinckley et al. 2005], crossing-based menus [Apitz & Guimbretière 2004], or hovering widgets [Grossman et al. 2006]. We decided to keep the interaction techniques at the beginning similar to those of the standard mouse, in order to enable us to perform the comparative evaluation study discussed in section 3.3.4 (p. 83). Thus the interaction performance of the input devices could be investigated with minimal influences from other undesired factors. Moreover, this initial setting builds the reference design for developing and evaluating more uncommon interaction techniques such as pointing gestures, crossing-based menus, or other new techniques.
So far, infrared laser pointers were mostly used in military settings for weapon training with high power laser diodes. For safety reasons, we needed a very low power laser pointer which we therefore had to build independently. Moreover this infrared laser pointer should be equipped with physical buttons which transmit their state (button pressed / released) wirelessly to a receiver in order to allow for the mobility needed for physical navigation in front of a LHRD. For the first version of our interactive laser pointer we developed, in cooperation with the “Wissenschaftliche Werkstätten[21]” of the University of Konstanz, a pen-shaped laser pointer with an IMM-CD849B low power infrared laser diode and a battery compartment for two AAA batteries (see Figure 20). In order to realize physical buttons and wireless data transmission, we used the button module and the infrared transmission system of a commercial remote controller (Infiniter LR1 PowerPoint Wireless Remote Controller). We shortened the original remote controller, mounted it on top of our laser pointer and connected the power cables to our battery module. The remote controller came with a USB infrared receiver which converts the pulsing infrared signal to page-up and page-down key events originally designed for controlling Microsoft Powerpoint. We converted these keyboard events into left and right mouse button events in order to fully provide the same functionality as the mouse. This allowed users to use our interactive laser pointer and a standard mouse interchangeably which provides an optimal evaluation setting for a controlled experiment. Unfortunately, the emission angle of the data transmission diode was very narrow which restricted the mobility to a small cone-like interaction space. We therefore manipulated the emission angle by applying a small hot glue dot on the diode lens resulting in a wider distortion of the pulsed infrared light. This was a very simple trick that improved the interaction angle; however the user was still restricted with respect to angle (about 60 degree) and distance (about 2 meters) to the receiver. Moreover, the data transmission only worked with a direct line-of-sight between laser pointer and receiver, which is not always supported in collaborative settings in which multiple people are moving in front of a LHRD. Nevertheless, the first version of our interactive laser pointer enabled us to gain first insights and experiences and to perform quantitative experiments.

Figure 20: Version 1 of the interactive laser pointer based on a pen metaphor (built in December 2006). The laser pointer is equipped with a low power infrared laser diode, battery compartment, and an augmented button module with infrared transmission component (on top).
Version 2
In order to improve mobility, we decided to develop a second laser pointer version which integrates a wireless data transmission of the physical button states based on a ZigBee[22] module replacing the infrared data communication of Version 1. ZigBee defines a high level network protocol for low power radio-frequency communication. In contrast to the former optical data transmission, radio-frequency communication does not require a line-of-sight and the utilized ceramic antenna enables communication ranges of almost 20 meters (unfortunately the metallic case impaired the communication quality – Version 3 addressed this problem by using plastic windows). Furthermore, a custom-built button module was directly embedded in the case. In order to emphasize the analogy to mouse interaction, the buttons which emulate the left and right mouse buttons are also physically positioned to the left and right. Thus, the perceived affordance could be increased by fitting the physical layout to the mental model of the user. A third button was positioned in front of the two buttons forming the corner points of a notional triangle (see Figure 21). The intention was to highlight the third button as user-programmable button and to emphasize the orientation of the laser pointer. The visual communication of the “top” of the laser pointer was further supported by forming the hardware case like a text marker. This was meant to facilitate handling the laser pointer like a pen, whereas the rectangular body of the case and the button layout on the upper side were suggestive of a TV remote control. These two variants of handling reflect our experiences that users change their handling dependent on their distance to the LHRD. If they are writing directly on the LHRD, as they may be used to doing on a blackboard, they handle the laser pointer like a pen. When steering to a specific point from far away, they handle the laser pointer in the whole hand as is familiar from using remote controls. Thus we supported both handling variants and also gained case volume in comparison to the cylindrical shape of Version 1. This enabled us to reduce the length of the laser pointer by placing the batteries side by side. Since users of the interactive laser pointer can control a LHRD from distant positions, they are not always able to perceive the visual feedback of the operating system, e.g., changing the icon of the pointer. We therefore integrated multicolour LEDs directly on the laser pointer closed to the buttons. Thus, users get personal feedback wherever they are.


Figure 21: Second generation of our interactive laser pointer with embedded button module, multicolour LEDs for visual feedback and wireless communication based on ZigBee (built in June 2007). The case design supports two different handlings styles: pen-like writing as known from text markers or controlling from distant positions as known from TV remote controls.
Version 3
Thanks to the successful tests with the first and second version of our laser pointer we were given the opportunity to contribute to the artistic installation Globorama which had been designed by Bernd Lintermann of the ZKM | Karlsruhe and Joachim Böttger of the Computer Graphics and Media Design Group of the University of Konstanz. The idea was to use our interactive laser pointer to navigate within high-resolution satellite images which are displayed on a large 360° panoramic display. However, this project raised very tough requirements: The laser pointer was required to function for 8 hours a day over at least four weeks without any support. Thousands of visitors were expected to visit the installation and interact with the laser pointer. The laser pointer needed to be safe from theft and stable enough to endure thousands of clicks. And the aesthetic appearance and perceived affordance required further improvement.
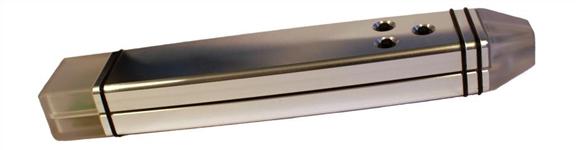
Figure 22: Version 3 of the interactive laser pointer with improved button module, visual feedback on both ends, accelerometer for gesture recognition, mechanical vibrator for tactile feedback, ZigBee wireless communication, and an alternative wired option (built in September 2007).
In order to address these requirements we developed the third generation of our laser pointer which consisted of a translucent PVC case (polyvinyl chloride) strengthened by two aluminium shells. For improved maintainability the shells were clamped by three o-rings enabling battery replacement without the need of a screw driver or any other tool. We choose the translucent PVC case because of several reasons: First, the communication quality could be improved, since the ZigBee antenna was no longer covered by the metallic case. Second, the weight of the laser pointer could be reduced. Third, additional visual feedback could be provided at both ends of the laser pointer by embedding multicolour LEDs. Sandblasting was used to achieve an equally diffuse illumination at the translucent surface of the PVC case. The ZigBee microcontroller as well as the button module was integrated on a professionally built double layer circuit board. In order to improve the ergonomic handling of the buttons and their perceived affordance, the button size was increased and the visual contrast was improved by using black plastic knobs on the brushed aluminium background. Furthermore we designed the third version as a multimodal user interface. In addition to manually pointing with the laser diode, physically pressing the buttons, and visual feedback given by the LEDs, we furthermore integrated a three-axis accelerometer with a sensitivity of ± 6g that enabled the identification of moving gestures and orientation of the laser pointer. Based on this laser pointer version, diverse gestures sets for mind mapping sessions were investigated in the course of the masters thesis by Anton Stasche [Stasche 2008]. Moreover, a mechanical vibrator was integrated into the laser pointer providing tactile feedback as an additional feedback modality. Therefore, the third generation of our laser pointer provided various interaction possibilities and great potential for further research. Since the laser pointer needed to be safe from theft, we decided to also develop a wired version for the artistic installation Globorama. Thus no battery had to be replaced and the data communication was not influenced by the handling of the laser pointer. This was also a disadvantage of the wireless version. The antenna of the ZigBee microcontroller was positioned at the end of the laser pointer where no metallic case restricts the data transmission. However the users tended to keep the end of the laser pointer very close to their body which also leads to a remarkable disturbance of the wireless data communication. In September 2007, the wired version was exhibited at the ZKM PanoramaFestival[23] in Karlsruhe and in May 2008 at the ThyssenKrupp Ideenpark[24] at the trade fair centre Stuttgart with great success and was used there by several thousand visitors (see section 0, p. 87 for more details).
Prototype 3.5
Since mobility is a fundamental requirement for an input device designed to support physical navigation in front of LRHDs, we redesigned the interactive laser pointer in order to achieve fully functional wireless data communication. Our approach was to arrange the antenna beside the laser diode at the top of the device in order to achieve more distance from the human body, the metallic case of the device, and other shielding objects. Thus, the head of the device has to be enlarged and reshaped. Unfortunately, the resulting hardware design did not turn out to be satisfactory. We asked several scientific, industrial and non-expert users for their opinions and reactions to the device. They commented that the laser pointer’s look and feel was very technical and massive and some people even mentioned that it looks like a weapon. We therefore decided to stop further development steps of this version and looked for better designs.

Figure 23: Prototype of the next laser pointer generation 3.5 (built in December 2008). The antenna is integrated within the translucent head and the lower side is rounded for better ergonomic handling. Since the hardware design was not satisfactory, development was not finished.
In a first step, we asked students of the course “Interaction design for high-resolution displays” to design a new pointing device with modelling clay (see Figure 24). They were informed about the current design and were free to develop an improvement of the current version or a completely new device. Some of these device prototypes were very ambitious and in practice not realizable or were designed only for a very specific usage context. However, almost all designs showed ergonomic shapes and the proposed handling modes were quite common. Based on the discussions during this design workshop we agreed on two clay models which we considered suitable for further improvement (see Figure 25 and Figure 26). The first one was very much in contrast to the pen- and remote control-like shape used before. Due to its size and shape it keeps the finger muscles in a relaxed medium contracted posture (both agonist and antagonist muscles in balance) which results in ergonomic handling. In order to further investigate this rather mouse-like design, we gave the clay model to an industrial partner who constructed a three-dimensional plastic prototype based on a rapid prototyping printer (see Figure 25).
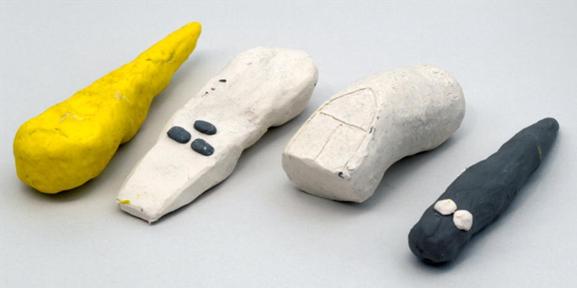
Figure 24: A collection of design ideas for a new pointing device as inspiration for the redesign of the interactive laser pointer (just four representative models of over 10 created design concepts). The device prototypes were made by students and lecturers of the course “Interaction design for high-resolution displays” in winter term 2008/2009.


Figure 25: Proof-of-concept prototype (disassembled in the left figure, assembled on the left side of the right figure) of the selected mouse-like clay model (at the very right). The clay model was converted into a digital CAD[25] model and physically printed with ABS [26] material.
The other clay model we selected for further investigation was an improvement of the earlier laser pointer versions which were stimulated by the pen and remote control concept. This clay model was designed by the author of this thesis based on experiences and insights gained in previous project work. The shape of this model has a narrow waist in terms of width and height in order to enable a comfortable grip (see Figure 26). Still both ends are large enough to accommodate the microcontroller, antennas and sensing technology. Moreover the edges are rounded to reduce pressure at the contact areas at the hand. In order to support both right- and left-handed use, this shape was design symmetrical. In several discussions the ergonomic quality of taking and releasing the device (e.g., from a desktop) was considered resulting in a further design variant: the clay model was completely arched, offering space below its waist. Therefore the user was able to pick up the device directly without the need to reposition their fingers. This arched design was also chosen in order to improve the perceived affordance of picking up the device based on the visual analogy to an arched pot handle. In general, the basic intention was to provide a more slight and graceful design with organic curves and better ergonomic handling. In contrast to the weapon-like prototype preceding it, this design was meant to associate with positive feelings and should lower physical as well as psychological thresholds for its usage.


Figure 26: Clay model of a new hardware design for the interactive laser pointer. The design is characterized by organic curves and a slight appearance. The upper figure illustrates the first straight version, whereas the lower figure presents the improved design providing easier device acquisition.
Version 4
With the help of the clay models and based on various discussions and informal interviews we decided to implement the curved device design. The mouse-like clay model (see Figure 25) did not stimulate absolute pointing behaviour in mid-air in contrast to the curved version (see Figure 26) which kept a basic pen- or laser pointer-like shape. Moreover, the curved version also facilitated direct writing on the display analogue to writing on blackboards. Technically, the curved version also provided better potential for wireless communication thanks to the larger size which ensured that the antenna is not covered by the hand or other body parts. Based on the clay model, a digital CAD model was made in order to explore its technical feasibility and to construct the detailed electronic and mechanical design (see Figure 27).


Figure 27: CAD models of the fourth generation interactive laser pointer, simulating different materials and surface treatments (designed in March 2009).
Modelling the laser pointer device in
digital space also enabled us to explore the visual effect of various
alternative materials and surface treatments such as brushed or varnished
aluminium and diverse coloured plastics. In order to further support the slim,
non-technical design we choose black polyvinyl chloride (PVC) as a basic
material. PVC provides a comfortable, smooth and warm haptic (PVC’s heat
transfer coefficient ![]() ) in
contrast to the formerly used brushed aluminium (
) in
contrast to the formerly used brushed aluminium (![]() ) and it is furthermore almost half of the weight with a density of
) and it is furthermore almost half of the weight with a density of ![]() (PVC)
compared to
(PVC)
compared to ![]() (aluminium).
Moreover, PVC does not have to be specially treated in order to be
corrosion-resistant. This is an essential requirement when hundreds or thousands
of users are touching the device during exhibitions over a longer period of
time. Aluminium can be varnished or anodised in order to prevent oxidation;
however this treatment only has an effect on the very thin surface layer. Thus,
mechanical impacts such as scratches are very apparent. Furthermore, PVC
provides more flexibility in positioning the antenna because of its lower
influence on radio-based communication as compared to metal-based materials.
Transparent PVC material is also available which can be used to produce
translucent inlays for the illumination of the physical buttons and the top of
the device providing visual feedback. A final reason for why we chose PVC was
that it is one of few plastic materials which can be treated with a CNC milling
machine[27]
offering higher production efficiency and precision. A disadvantage compared to
aluminium is the lower hardness of PVC. It also looks less valuable compared to
anodised aluminium; however this can also be an advantage in terms of lowering
the psychological threshold. Since most gaming devices are made with plastic
materials, PVC replaces the serious look-and-feel of former aluminium based
laser pointers with a more fun-related, harmless appearance.
(aluminium).
Moreover, PVC does not have to be specially treated in order to be
corrosion-resistant. This is an essential requirement when hundreds or thousands
of users are touching the device during exhibitions over a longer period of
time. Aluminium can be varnished or anodised in order to prevent oxidation;
however this treatment only has an effect on the very thin surface layer. Thus,
mechanical impacts such as scratches are very apparent. Furthermore, PVC
provides more flexibility in positioning the antenna because of its lower
influence on radio-based communication as compared to metal-based materials.
Transparent PVC material is also available which can be used to produce
translucent inlays for the illumination of the physical buttons and the top of
the device providing visual feedback. A final reason for why we chose PVC was
that it is one of few plastic materials which can be treated with a CNC milling
machine[27]
offering higher production efficiency and precision. A disadvantage compared to
aluminium is the lower hardness of PVC. It also looks less valuable compared to
anodised aluminium; however this can also be an advantage in terms of lowering
the psychological threshold. Since most gaming devices are made with plastic
materials, PVC replaces the serious look-and-feel of former aluminium based
laser pointers with a more fun-related, harmless appearance.
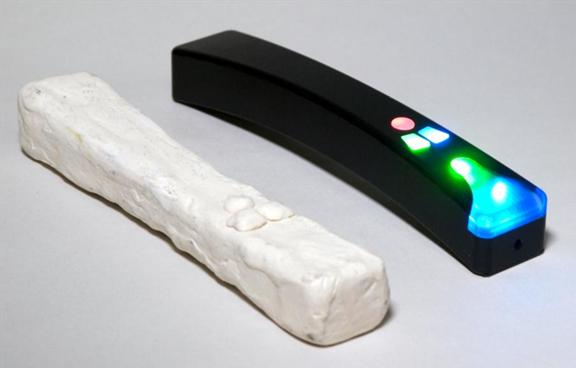
Figure 28: Initial clay model of the laser pointer (left) and the final device (right, built in October 2009).


Figure 29: Different perspectives on the interactive laser pointer of the fourth generation. Left: Illustration of the three axes measured by the inertial sensor (linear accelerometer).
The fourth generation of our interactive laser pointer was built in October 2009 and is the result of a three-year iterative improvement of the device technology, its visual appearance and the ergonomic hardware design. The development was driven by rapid prototyping (virtually and physically), empirical testing, user feedback, real-world applications and the effective cooperation between experts in different professions (e.g., electronics, mechanics, computer science and usability engineering). The final design provides all features of previous versions such as an infrared low-power laser diode, physical buttons, a three-dimensional accelerometer, and a mechanical vibrator. Moreover it provides fully functional, bidirectional wireless communication (serial data transmission protocol based on 868 - 915 MHz radio frequency). The communication is provided by a pair of microcontrollers of which one is integrated in the head of the laser pointer and the other is embedded in a USB module which can be plugged in a standard PC running our software toolkit. Multiple interactive laser pointers can be used in parallel without introducing interferences since each microcontroller pair uses an individual wavelength band. Besides transmitting button states and accelerometer data, the bidirectional communication enables the particular control of the vibrator and the illumination of the physical buttons as well as the LEDs embedded below the translucent inlay at the top of the device. That facilitates interaction techniques such as a physical colour chooser in which each button represents a different colour available for selection and the currently selected colour is represented by the visual feedback given at the top. The wireless data transmission is performance-optimized in order to reduce interaction lags and to offer high interaction speed as well as immediate feedback. In order to control the LEDs, vibrator motor, laser diode, accelerometer, data transmission mode, and power state, a single byte is sent via a specifically defined serial protocol (see following data type definitions).
|
Bit |
7 |
6 |
5 |
4 |
3 |
2 |
1 |
0 |
|
Values |
1 |
1 |
LED REGISTER NUMBER 011 = button centre 101 = button right 001 = two front ambient LEDs 010 = front centre LED |
RED 0 = off 1 = on |
GREEN 0 = off 1 = on |
BLUE 0 = off 1 = on |
||
Table 1: Definition of the data byte for setting the colour of the specified multicolour LED.
|
Bit |
7 |
6 |
5 |
4 |
3 |
2 |
1 |
0 |
|
Values |
1 |
0 |
0/1 |
0/1 |
0/1 |
0/1 |
LASER 1 = on |
MOTOR 0 = off 1 = on |
Table 2: Definition of the data byte for controlling the vibrator motor and the infrared laser diode.
|
Bit |
7 |
6 |
5 |
4 |
3 |
2 |
1 |
0 |
|
Values |
0 |
0 |
0/1 |
0/1 |
0/1 |
TRANSMISSION |
ACCELERO- 0 = off 1 = on |
POWER 0 = active 1 = sleep |
Table 3: Definition of the data byte for setting the data transmission mode (continuous or on request), the accelerometer state, and the power mode. Pressing the centre button on the laser pointer reactivates the microcontroller from power-saving sleep mode.
|
Bit |
7 |
6 |
5 |
4 |
3 |
2 |
1 |
0 |
|
Values 1st byte |
DEVICE IDENTIFICATION NUMBER |
BUTTON- 0 = up 1 = down |
BUTTON- LEFT 0 = up 1 = down |
BUTTON0- RIGHT 0 = up 1 = down |
||||
|
2nd |
ACCELEROMETER VALUE Z-AXIS |
|||||||
|
3rd |
ACCELEROMETER VALUE X-AXIS |
|||||||
|
4th |
ACCELEROMETER VALUE Y-AXIS |
|||||||
|
5th |
BATTERY VOLTAGE |
|||||||
Table 4: Definition of the data byte(s) giving feedback about button states and optionally (if accelerometer is activated) also about the acceleration values on the three axes (see axis orientation in Figure 29, left) as well as the current battery voltage. This feedback is sent continuously (push mode) or alternatively on request (pull mode) any time a byte is received at the laser pointer’s microcontroller.
In order to bundle all this multimodal input and output technology as well as the embedded microcontroller, batteries, and antenna within this small and highly curved device case, a sophisticated construction for the arrangement of the components and the multi-layer circuit boards were needed. In close cooperation with mechanics and electronics experts of the “Wissenschaftlichen Werkstätten” of the University of Konstanz, we constructed the hardware design with respect to following requirements (discussed together with our final solutions):
· Device shape: the iteratively developed curved design of the hardware case should be preserved despite technical complexity. The electronics parts were distributed on three circuit boards connected by ribbon cables enabling the tight arrangement of the boards adjacent to the batteries, below the upper surface for button support, and at the top of the device to provide visual feedback under the translucent inlay as well as to offer an optimal position for the antenna (see Figure 31).
· Weight distribution: the centre of gravity should be in the hand (second half of the device length) in order to enable comfortable handling. This is achieved by positioning the heavy two AA batteries one after another at the tail of the device (see Figure 30).
· Wireless communication quality: the antenna should have maximum distance to any shielding material. This is achieved by arranging the antenna directly at the top of the laser pointer even before the laser diode (which has a metallic case). The antenna is therefore given the largest possible distance to the hand of the user, to the user’s body and to other parts of the device.
· Button arrangement: the three buttons should be easily accessible, should provide good tactile feedback, and should support the visual design concept. We arranged the buttons at the first fourth of the device length which is a good position for ergonomic interaction with the thumb. Since it is easier to adduct the thumb from this comfortable position than to abduct, we arranged the third (user programmable) button behind the “left” and “right” buttons which are also more often used than the third one. In order to support blind interaction, we provide passive tactile feedback of the buttons based on their physical design. They stick out at the top of the device thanks to their slightly higher dimensions and the curved design of the device case. Moreover the surfaces of the buttons are polished in contrast to the grooved surface of the device case. In order to communicate the differences between the left/right and the third button, we gave them unique forms (trapezoid vs. circle) and arrangements (left, right, centre). The visual form resulting of the button shape and their arrangement is very similar to the shape of the translucent inlay at the top of the device. Thus the visual design concept is applied consistently (see Figure 29).
· Active tactile feedback: the tactile feedback provided by the vibrating motor should be perceivable. We therefore positioned the vibrator closed to the button module in order to transmit the vibrations to the buttons as well. If tactile feedback is given by the vibrating motor when a button was successfully pressed, the user has the impression that the physical button is vibrating. Thus we can provide direct feedback at the location where the interaction takes place. To ensure that the tactile feedback is also perceived if the user does not touch a button at this moment, the vibrating motor is directly mounted to the PVC case which transmits the vibration also to user’s hand (see Figure 30).
· Easy maintenance: the interactive laser pointer should be easy to maintain. We choose to use standard batteries which are inexpensive and available almost everywhere. In order to prevent vandalism the batteries are covered and locked by a single screw. As an alternative to battery replacement, we also provide a USB charging cable which can be plugged in any powered USB port without the need of a specific driver (see Figure 32). At the side of the laser pointer, the charging cable is connected to a lockable, tight-connection cable port which enables permanent power connection, e.g., for the utilization of the laser pointer in exhibitions. Therefore, there is no need for the replacement of the batteries and the tight-connection port prevents damage caused by tension. The charging cable is very flexible and available in different lengths. If other electronic parts of the laser pointer have to be repaired, they are accessible by removing the maintenance cover at the bottom of the device which is locked by a single screw. The circuit boards are fixed by screws and connected via plugged ribbon cables. Thus, all parts of the device are easily accessible and replaceable within minutes if needed.

Figure 30: CAD model of the milled PVC main case showing the battery compartment and the mountings for the circuit boards, buttons, power port, and vibrator.

Figure 31: Circuit boards of the interactive laser pointer (individually scaled for better visibility). Upper left: button module with LED illumination and inertia sensor. Upper right: microcontroller board with antenna, laser diode connection and all input/output signal conductors. Bottom: main board with power and load management as well as vibrator connection. See Appendix A, p. 157, for further layouts.

Figure 32: Interactive laser pointer with open battery compartment, released maintenance cover, rechargeable batteries, and USB charging cable. The covers can be slid in from the corresponding side (head or tail) and fixed with the screw. Thus the plain covers accommodate their form to the arched shape of the main case.
3.3.3.3 Interactive Laser Pointer @ Design Space Classification
For the sake of clarity and completeness, we describe in the following our final design of the interactive laser pointer along with the design space classification introduced in section 3.2 (p. 41). Moreover, this systematic description enables direct comparison with future versions and other solutions. Since the interactive laser pointer integrates three different input sensors which have to be considered specifically, we enumerate them as follows.
Input sensors of the interactive laser pointer:
(1) Camera-based tracking of the optical reflection caused by the infrared laser diode
(2) Inertial sensing based on the three-dimensional accelerometer
(3) Physical buttons
|
INPUT DEVICE PROPERTIES |
Interactive laser pointer (fourth generation) |
|
- Physical property sensed |
(1) Position of the reflection of the infrared laser diode (2) Motion and orientation of the laser pointer device based on the accelerometer (3) Position of the buttons (up/down) |
|
- Type of motion |
(1) Linear movement (2) Linear and angular movement (3) Linear movement |
|
- Continuous vs. discrete input |
(1) Continuous input (2) Continuous input (3) Discrete input |
|
- Degree of freedom |
(1) Three integral dimensions (2) Three integral dimensions for motion and two integral dimensions for orientation (no valid measure for the orientation with respect to the gravity axis ) (3) Three separable dimensions |
|
- Agent of control / input modality |
(1) Hand / arm, active input mode (2) Hand / arm, active or passive input mode (3) Finger, active input mode |
|
- Direct vs. indirect control |
The device can be utilized directly on the display, but also from a distant position. The device is a physical intermediary. The triggered action and visual feedback can be directly related to the input (dependent on the application design). |
|
- Feedback / output modality |
Tactile & kinaesthetic feedback: - vibrating motor (active) - physical button design, e.g., shape, displacement distance, displacement force (passive) - pen-based design of laser pointer device (passive) Visual feedback: - illumination of all three buttons (active) - ambient and centre LEDs at the head (active) Acoustic feedback: - mechanical click sound when pressing the buttons (passive) - no active sound feedback at the device, but possible in combination with a external sound system e.g., for providing surround sound |
|
- Multi-device, multi-user support |
Thanks to the utilized radio-frequency band, communication protocol, and microcontrollers, interference with other input/output devices is almost impossible. Dependent on the implemented interaction technique, the input of the interactive laser pointer replaces or complements current standard input devices. Multiple laser pointers can be used in parallel: the wireless data communication works without interference and the number of optically tracked laser pointer reflections is only limited by the tracking resolution and the size of the display. However, the identification of an individual user has to be done on the application layer. |
|
INPUT DEVICE PARAMETERS |
|
|
- Resolution |
(1) dependent on number and type of cameras and lenses used and distance to the projection surface (2) about 0.03 g resolution (3) 1 (just one sensor at each button) |
|
- Sampling rate |
(1) between 80 and 120 frames per second (2) analogue sensor, continuous measurement (3) analogue sensor, continuous measurement |
|
- Lag |
(1) about 6.7 ms in average for image acquisition and additional 10 ms for image analysis (2) about 8.3 ms in average caused by data transmission (3) about 8.3 ms in average caused by data transmission |
|
- Transfer function |
(1) position-to-position (dependent on interaction technique) (2) velocity-to-position (dependent on interaction technique) (3) position-to-position (dependent on interaction technique) |
|
- Hardware design |
Pen- and remote controller-based hardware metaphor, milled PVC case, grooved surface, curved design, black case with translucent illuminated inlay and white back-illuminated buttons, removable batteries, maintenance cover, power port with suitable USB charging cable Dimensions: width total: 3.4 cm (min. body width: 2.5 cm) height total: 3.4 cm (body height: 2.3 cm) length total: 19.2 cm Weight: about 160 grams (dependent on battery type) |
|
- Naturalness |
The well-known laser pointer is used not merely as a presentation aid for accentuation purposes but additionally to control the cursor or generally the entire user interface. Users typically utilize a laser pointer as a natural extension of their hand, so the cognitive load for interaction is imperceptibly low since pointing is a fundamental human gesture. The mental association of physical laser pointer and virtual cursor movement is easy and is processed subconsciously. |
|
- Motor space / footprint |
(1) Since the reflection of the laser diode is tracked, users can point to almost any pixel on a LHRD just by turning it without the need of moving the device to another location (e.g., as known from the mouse). (2) Dependent on the utilized interaction technique. (3) Only the button is pressed; the device can keep its position and orientation. |
|
- Mobility |
(1) Entire room, as long as the device points at the display and a reflection of the laser diode is trackable. (2) Only limited by the wireless communication range (about 20 meters in buildings and more than 50 meters with unobstructed line-of-sight) (3) Only limited by the wireless communication range |
Table 5: Specification of our interactive laser pointer (fourth generation) along the design space classification introduced in section 3.2, p. 41.
The design space classification also considers usability measures which describe the resulting qualities of the selected design. In the following, we will discuss a controlled experiment investigating the effectiveness and efficiency of using the interactive laser pointer and complement these quantitative findings with practical experiences and more qualitative findings gained in the course of the artistic installation Globorama (see 0, p. 87).
3.3.4 Evaluation
In order to assess the general feasibility of the Laser Pointer Interaction for LHRDs, an experiment on the basis of the ISO standard 9241-9 with the first version of our interactive laser pointer was already conducted in February 2007 on the Powerwall of the University of Konstanz. The primary goal of this study was to compare the interactive laser pointer to the mouse as the standard input device. Existing studies that have been carried out with normal projection displays suggest that interaction with the mouse is more precise and faster – with the drawback that a stationary surface is needed for its use. With the laser pointer, however, participants can move freely in front of the display. Apart from comparing the two devices, the effect of eye-to-display distance was also under scrutiny. Peck [2001] examined the deviation when pointing at a fixed target with a regular red laser pointer from a distance of 1.5 m and 3 m. Similarly, Myers et al. [2002] examined 1.5 m, 3 m, and 4.5 m. The results of both studies underline the intuitive assumption that the laser pointer’s performance deteriorates at larger distances due to the effects of natural hand tremor.
The experiment was based on the unidirectional tapping task (Fitts’ tapping task) for evaluating the “efficiency and effectiveness of existing or new input devices” as described in ISO 9241-9 (cp. [Douglas et al. 1999]). The unidirectional tapping task is a serial point-and-select task with users controlling the on-screen pointer to alternately click on two targets of width W that are aligned horizontally at a distance (amplitude) A. Participants were asked to alternately select the targets as quickly and precisely as possible (see Figure 33). These types of tests were pioneered by Fitts ([Fitts 1954], [Fitts & Peterson 1964]) and have been applied in several evaluation studies concerning input devices (cp. [MacKenzie 1991]).
3.3.4.1 Participants and Design
Sixteen participants (8 female, 8 male) aged 19-30 were recruited via different mailing lists at the University of Konstanz. Most of the participants were students at the university; none were students from the computer science department. The test was designed as a 2×2 within-subjects design with the factors device (mouse and laser pointer) and distance (3 m and 6 m) appearing in combination in the different conditions. The order of these four conditions was counterbalanced across participants, using a Latin square design. The dependent measures included movement time MT in seconds, error rate Err, as well as the effective throughput or effective index of performance IPe in Bits/s. The latter represents one of the benchmarks for comparing input devices and is one of the most widely used measures for the appraisal of input device performance (a detailed discussion can be found in [MacKenzie 1991]). The calculations of effective width (We), effective index of difficulty (IDe), and effective throughput were carried out as suggested by ISO 9241-9 or [Soukoreff & MacKenzie 2004] respectively. In the experiment, targets having width W of either 80 pixels (9 cm) or 140 pixels (15 cm) and a centre-to-centre distance A of 550 pixels (62 cm), 1350 pixels (151 cm) or 3800 pixels (426 cm) were used, corresponding to levels of difficulty (index of difficulty, ID) between 2.3 Bits (easy), and 5.6 Bits (hard). The index represents both the width W and distance A in a single value. The configurations provided target stimuli that covered the central, proximal, and peripheral space of the Powerwall display. 15 trials had to be performed for each of the 2 (A) x 3 (W) target configurations. A trial was considered to consist of the movement towards the target, and its subsequent selection via a click. Hence, a block was complete after 2 x 3 x 15 clicks (as a minimum) plus one additional click for each configuration to select the first target (96 clicks in total). The order of the W-A configurations was random for every block and participant.

Figure 33: Unidirectional Tapping Task with width W and amplitude A based on ISO standard 9241-9.
3.3.4.2 Apparatus & Procedure
The experiments were conducted on the premises of the Powerwall facility in the University of Konstanz. Participants stood in front of the 5.20 × 2.15 m display during all of the experimental conditions. A Logitech MX Laser Cordless Mouse was employed for the mouse conditions. The pointer speed was kept at a medium level to let the movement range cover the complete screen area without clutching. The level remained constant throughout the experiment. A 1.10 m high lecture desk provided the stationary rest for the mouse – this is the current standard practice for interacting with the display. The custom-built laser pointer (version 1, see section 3.3.3.2, p.68) could be handled freely. The interaction (click events and pointer movement) was recorded by a software suite specifically developed for this evaluation and that also provided all the task stimuli (targets to click). It ran on the main computer connected to the Powerwall display with the maximum resolution of 4640 × 1920 pixels. The standard pointer of Microsoft Windows Server 2003 was used. Demographic data and preference ratings (for device choice) were obtained with the help of pre- and post-test questionnaires respectively. At the beginning of each session the participant was welcomed in the reception area of the facility and given a short overview of the procedure. After reading a short written introduction and filling out the pre-test questionnaire, the participant was given a description and concurrent demonstration of the test. It was emphasized that the targets had to be selected “as quickly and accurately as possible” (see Appendix B, p. 158, for more details). The participant was then asked to stand at a distance of 3 m or 6 m centrally in front of the display. In order to allow her/him to become accustomed to the device and distance, every test condition began with five blocks of a 64-click task that was not considered for analysis. Hence, in total each participant had to perform at least 1664 clicks: for each of the four conditions 64 x 5 clicks for training plus 96 clicks for the task.
3.3.4.3 Results
Of the 5760 unidirectional trials, 18 were identified as outliers due to accidental double clicks or other disturbances in a regular trial and were removed from the analysis.
As expected, the performance of the mouse was generally better than the performance of the laser pointer (see Figure 34). At a distance of 3 m, a mean IPe of 3.52 Bits/s for the laser pointer and 3.96 Bits/s for the mouse was measured. The error rate (Err) at 3 m was 8% for the mouse and 14% for the laser pointer. Average movement times of 954 ms for the mouse and 1086 ms for the laser pointer were obtained. Significant effects of the factor device were found for all measures IPe (F1,15 = 30.570, p < 0.001), Err (F1,15 = 57.767 p < 0.001), and MT (F1,15 = 21.487 p < 0,001).


Figure 34: Mean effective throughput of the interactive laser pointer (blue) and the mouse (orange).
Compared to the mouse, it was expected that the laser pointer’s performance would be worse at greater distance. The results confirmed this assumption. Distance-device interaction effects could be found for IPe (F1,15 = 8.627 p = 0.010) and Err (F1,15 = 6.489, p = 0.022). Analysis of the simple effects of distance show that laser pointer performance is significantly (F1,15 = 11.59, p = 0.004) better at a distance of 3 m (3.52 Bits/s) compared to the performance at 6 m (3.17 Bits/s), whereas no significant difference could be observed for the mouse. Moreover, the laser pointer’s accuracy deteriorates significantly with increasing distance (F1,15 = 19.76, p < 0.001), from 14% at a distance of 3 m to 20% at a distance of 6 m. Again, no significant difference could be observed for the mouse. The laser pointer’s movement time increased slightly from 1086 ms to 1133 ms, but this difference was not found to be significant.


Figure 35: Mean error rate (left) and mean movement time (right) for both devices and both distances.
After the session, participants were given the post-test questionnaire so that they could report their impressions about which device enabled them to work faster and which was less error-prone. The participants’ assessments correspond to the quantitative results reported earlier in view of the fact that only one participant claimed to have worked equally quickly and accurately with both devices. Ten participants generally favoured the mouse, five the laser pointer, with one participant undecided. Reasons given in favour of the mouse were the greater confidence when using this common pointing device, in contrast to the novelty and unfamiliarity of the laser pointer. However, some participants would greatly favour the laser pointer for use in presentations, for example, due to the gain in flexibility provided.
3.3.5 Globorama: Laser Pointer Interaction between Art and Science
In addition to the experimental findings, we were also able to gain practical experience “in the wild” by utilizing the interactive laser pointer for the artistic installation Globorama. This is a cooperation project of the Computer Graphics and Media Design Group of the University of Konstanz, the Institute for Visual Media of the ZKM | Center for Art and Media Karlsruhe, and the Human-Computer Interaction Group of the University of Konstanz. Here, a large, high-resolution panoramic display was equipped with our laser pointer interaction enabling navigation within high-resolution satellite and aerial images as well as selection of georeferenced data such as panoramic photographs or camera live streams of the respective location (see Figure 36). The satellite images were warped on the cylindrical display using a distortion algorithm based on the complex logarithm developed by Böttger et al. [2008] (see Figure 37).


Figure 36: Surrounded by 360°-satellite images of the earth, visitors of the artistic installation Globorama explored the entire globe with the interactive laser pointer and submerged at selected points in georeferenced panoramic photographs or webcams of the respective location. An overview of the world (right) could be opened with the “WORLD” button (right button) on the laser pointer enabling a guided navigation to the selected location.
The visitor was able to physically move inside the 360° panoramic screen (8 meter in diameter, 8192 x 928 pixels resolution) while dynamically controlling zooming and panning by pointing to interesting areas and pressing the “NAVIGATION” button (left button). The “HOME” button (middle button) on the interactive laser pointer activated the automatic navigation to the real location where the user was: the respective venue at which the installation was presented. Whenever the user crossed a selectable icon representing georeferenced information, the laser pointer vibrated for 200 ms and thus provided tactile stimulation. Visual feedback was given by the integrated LEDs which changed their colour according to the current button status. Furthermore, an ambient sound was created in real-time and was modulated dependent on the location which the visitor pointed at. Therefore, the visitor was completely integrated in the immersive environment, could physically move within the screen, could navigate virtually by pointing to interesting areas, and received multimodal input on different senses: sight, touch, and hearing.


Figure 37: A detail-in-context visualization based on the complex logarithm is used to warp the high-resolution satellite and aerial images on the cylindrical screen [Böttger 2009]. The magnification of the visualization is controlled by zooming with the interactive laser pointer causing a movement of the displayed stripe as illustrated in the figures (a zoom into the “Schloßplatz” in Karlsruhe is illustrated from left to right).


Figure 38: Left: The four cameras covering the entire panoramic display were assembled at the top ring of the display frame. They tracked a 90° large display area on the opposite side of the screen. Right: Globorama installation at the ThyssenKrupp Ideenpark 2008 in Stuttgart.
From a technical perspective, the tracking of the very small infrared reflection (about 2 mm in diameter) of the low-power laser diode (0.55 mW) was very challenging due to the fact that the four cameras were positioned on the opposite side of the tracking area more than 8 meters away (see Figure 38, left). In the case of the second exhibition of Globorama at the ThyssenKrupp Ideenpark 2008 in Stuttgart, the distance was even larger due to the increased dimensions of the PanoramaScreen with a diameter of 10 meters (see Figure 38, right). However, the developed tracking algorithms functioned very well with this extreme environment. Moreover, the usage of the laser pointer interaction for an exhibition required a high degree stability of the hardware and software system and simple maintenance. The installation was exhibited over weeks and was only started and stopped with a single key press done by a normal museum attendant. Switching the power on led to a complete initialization of the projectors, cameras, audio system, multiple computers connected via Ethernet, and finally of the applications. Pressing a pre-defined key short-cut on the computer on which the visualization ran caused an automatic shut-down of all components. At the beginning of the first installation, we were confronted with an unstable wireless connection for the data transmission between the interactive laser pointer and the wireless receiver connected to the PC. We developed a workaround based on repeated reconnection of the wireless communication which solved the problem temporarily. Based on these practical, long-term experiences, we redesigned the laser pointer hardware and changed the wireless antenna and microcontroller as discussed in section 3.3.3.2 (p. 68).
The Globorama installation was presented to the broad public from 29/09/07 to 28/10/07 at the ZKM | Center for Art and Media in Karlsruhe as the first installation of the ZKM PanoramaFestival[28] (about 5.000 visitors were counted). Furthermore, it was exhibited from 16/05/08 to 25/05/08 at the ThyssenKrupp Ideenpark[29] 2008 in Stuttgart (about 290.000 visitors).
In order to get qualitative feedback from the visitors, we laid out questionnaires (see Appendix C, p. 162) at the entrance to the room in which the Globorama installation was presented. 72 questionnaires were filled out and returned. This study had a very informal character and the results were dependent on many uncontrolled factors. However, the results can support previous quantitative studies or can show interesting trends which can be further investigated with controlled experiments. In the following we want to give a short overview.
In chapter 2 and 3, we already discussed the need for physical navigation in front of large, high-resolution displays. This was underlined by the visitors’ responses, since they rated the importance for moving around with the pointing device within the panoramic screen with a mean of 6.8 on an 8-point scale (1: unnecessary, 8: very important). Also 86% of the subjects answered that they actually did make use of this mobility.
They rated the interaction speed with a mean of 6.2 (1: not acceptable, 8: acceptable) and the interaction precision with a mean of 6.0 (1: very imprecise, 8: very precise) surprisingly positive, since the georeferenced icons for activating the panoramic photographs were very small and mostly several meters away. We therefore asked specifically for the difficulty of selecting these icons and they rated this similarly with a mean of 5.8 (1: difficult, 8: easy).
The mean rating for the overall effort of using the pointing device was 5.6 (1: very high, 8: very low). The fatigue of the finger was rated with 6.7, of the wrist joint with 7.2, and the arm with 7.2 also very low (1: very strong, 8: no fatigue).
The overall difficulty for using the pointing device was rated with 5.7 (1: very difficult, 8: very easy). This positive result was also supported by the mean rating for the joy of use with 6.8 (1: no fun, 8: high joy of use). We finally asked for an overall school grade (6-point scale) for the Globorama installation which was rated on average with 1.4, very positively (1: very good, 6: very bad).
3.4 Summary
In order to systematically design and evaluate a suitable input device for LHRDs we identified the design space of input devices in general and described them in a new design space classification. Existing input device taxonomies were integrated and complemented with so far unconsidered dimensions such as mobility, hardware design, output modality as well as multi-device and multi-user support. Based on this theoretical groundwork, we developed and presented an interactive laser pointer which particularly addresses the demanding requirements of large, high-resolution displays in the areas of mobility, accuracy, interaction speed, and scalability. The interactive laser pointer enables users to interact more naturally as compared to the indirect mouse thanks to the absolute pointing mode. Moreover, the camera-based tracking of the laser point reflection on the display surface provides great flexibility for moving around while interacting. We discussed the iterative development of in total four hardware design variants of the interactive laser pointer and presented a software toolkit which enables the distributed tracking and image analysis of multiple high-resolution camera streams. We verified the technical suitability of our laser pointer interaction by using it on two representatives of LHRDs, a curved 360° panoramic display at the ZKM | Center for Art and Media Karlsruhe and a planar 221″ Powerwall with a resolution of almost 9 megapixels at the University of Konstanz. The latter also provided the environment for a comparative evaluation study conducted with 16 participants to assess the general usability of the laser pointer interaction by comparing it with a conventional mouse, the current standard input device. In total, the participants carried out 5760 trials of the unidirectional tapping tasks (ISO standard 9241-9) with two devices (interactive laser pointer and mouse) and at two distances (3m and 6m). The results revealed that the laser pointer‘s performance, in terms of selection speed and precision, was close to that of the mouse (around 89 % at a distance of 3 m), although the laser pointer was handled freely in mid-air without a stabilizing rest. The experimental results also suggest, however, that, due to trembling of the user’s hand, the laser pointer’s performance deteriorates significantly with increasing distance.
4 Precision Enhancing Pointing Techniques
![]() Contents
Contents
In the previous chapter we introduced an absolute pointing device based on an augmented laser pointer that enables users to move freely while interacting with a large, high-resolution display. Although the interaction performance was promising, the error rate and effective index of performance deteriorated significantly with increasing distance to the display. We identified the limited human capabilities, in particular the human hand tremor and the limited motor precision as major reasons for this negative correlation between distance and interaction performance. The technology composed of the tracking system and the input device did not change at all with varying distances – in contrast to the human factor: the negative effect caused by trembling of the user’s hand increased with larger distances due to the 1:1 mapping characteristic of absolute pointing devices.
The classification of input device introduced in section 3.2 (p. 41) illustrates the design space for the development and the optimization of input devices. Since technology is not the cause of this deterioration in performance, the optimization of the technical input device parameters resolution, sampling rate and lag would not have a positive effect on this major issue. We will therefore introduce a novel interaction technique in this chapter that improves the interaction performance of absolute pointing devices based on a dynamic optimization of the transfer function, in particular the CD gain.
In the following, we will discuss the problem-domain of pointing accuracy and describe related work addressing this issue. In doing so, we introduce a novel classification scheme to more clearly discriminate between different approaches. Second, the Adaptive Pointing technique will be presented and described in detail. The intention behind this approach is to improve pointing performance for absolute input devices by implicitly adapting the Control-Display gain to the current user’s needs without violating users’ mental model of absolute-device operation. Finally, an experiment comparing Adaptive Pointing with pure absolute pointing is presented in which the laser pointer introduced in the previous chapter is used as an example of an absolute device.
4.1 Problem Domain
Absolute pointing devices use a position-to-position mapping (mouse: velocity-to-velocity) as the transfer function between the input device and the display pointer [Hinckley 2008]. As a result the user benefits from a more natural and convenient pointing experience [Myers et al. 2002] and easier hand-eye coordination compared with the decoupling of motor and display spaces and the non-linear pointer acceleration when using relative pointing devices. It is due to the direct mapping of absolute pointing devices, that the user can easily keep track of the cursor, since it is always in line with the user’s finger, stylus, laser pointer or any other absolute device.
Besides home entertainment (e.g., Nintendo Wii), there are various other application domains, for example, the fields of ubiquitous computing, visual analytics, collaborative environments and interactive exhibitions, in which users need the flexibility provided by absolute pointing devices to interact effectively. Especially in combination with LHRDs, input devices are required that provide sufficient mobility for supporting users’ physical navigation (as already discussed in chapter 2, p. 21). This trend is also reflected in research literature, with several authors proposing solutions for absolute input devices such as freehand pointing [Vogel & Balakrishnan 2005] or laser pointer interaction [Myers et al. 2002], [Oh & Stuerzlinger 2002].
However, a common problem shared by all absolute input devices operated from a distance, particularly in combination with high-resolution displays, is pointing accuracy. Myers et al. [2002] concluded that “interaction techniques using laser pointers tend to be imprecise, error-prone, and slow”. Vogel & Balakrishnan [2005] reported a similar result for their comparison of absolute, relative and hybrid mapping of hand movements. While the absolute technique was significantly faster than the hybrid and relative ones, the high error rates of the absolute mapping “prevent it from being a practical technique” [Vogel & Balakrishnan 2005]. Based on previous related work and our experience, we identified two main factors for this serious imprecision of absolute pointing devices used in midair: deviations are caused by natural hand tremor and limited human motor precision. After discussing these two aspects in detail, we will present the Adaptive Pointing technique, an approach which continuously changes the CD gain of an absolute pointing device to enhance the pointing accuracy while preserving the behaviour of an absolute pointing device.
4.1.1 Natural Hand Tremor
The task of maintaining a part of a limb in a constant position produces involuntary muscular contraction with rhythmical oscillations (8-40 Hz) referred to as physiological tremor [Vaillancourt & Newell 2000]. When using freehand pointing or absolute pointing devices in midair without a stable rest, natural tremor causes serious noise, which makes accurate pointing and selection more difficult or even impossible as the distance between display and user increases. Myers et al. [2002] investigated performance factors for different absolute pointing devices and postures by measuring pointing deviation around a small target. They reported an average deviation (10 feet / 3 m distance) of 0.14 degree (7.3 mm) for a laser pointer held close to the body and 0.17 degree (8.9 mm) holding the same laser pointer at arm’s length. Hence the user would have problems in reliably selecting an object or button smaller than 30 pixels on a common display (96 dpi) or 7 pixels on a large high-resolution display such as the Powerwall of the University of Konstanz with 8.9 mega-pixels (22 dpi). Although this imprecision is a serious issue for controlling a common graphical user interface, it is fatal for application domains dealing with high-density information spaces, for example in the fields of data mining, information visualization or visual analytics. A variety of approaches exist for reducing noise and so for steadying the cursor. Myers et al. [2002] suggested averaging positions with a moving window (simple moving average). A drawback is that this introduces a noticeable time lag, which reduces the responsiveness of the pointing device. Myers et al. [2002] therefore disabled the smoothing when the distance between two successive points was larger than a predefined threshold - based on the assumption that the user does not worry about accuracy when moving a long distance. Sears & Shneiderman [1991] applied a similar technique for touch-based interaction. However, they used multiple distinct thresholds around the finger position to smoothen the movement. They switched between discrete modes of ‘no-movement’, ‘running-means’, and direct mapping. Wilson & Pham [2003] applied a similar approach to their WorldCursor Device, a pen-like pointing device based on a sensor combination of accelerometer and magnetometer. They also averaged the sensor values (yaw & pitch) but switched dynamically between a short (0.3 seconds) and a long (2.5 seconds) moving window depending on the average speed of cursor movement. Thus, they still achieved a slight smoothing effect with low delay for fast movements and were also able to provide very smooth slow movements for precise pointing and selection. The smoothing approaches of Myers et al. [2002] and [Wilson & Pham 2003] are both based on a binary decision and switch directly without a transition phase. This abrupt change of jitter and lag effect could therefore confuse the user. An alternative providing a smoother result would be to adjust the size of the moving window continuously. Vogel & Balakrishnan [2005] applied this idea of dynamic filtering to their freehand pointing technique by using a recursive low-pass filter with dynamic cutoffs. Thus, the pointer movement is smoothed with interpolated cutoffs between 0.25 Hz and 5 Hz depending on pointer velocity (between 10 - 200 mm/s). More reactive systems can be realized with a Kalman Filter. This recursive filter is widely used (e.g., [Oh & Stuerzlinger 2002], [Frolov et al. 2002], [König, Bieg, Schmidt, et al. 2007]) to model human pointing behaviour dynamically and to predict the next position based on previously measured deviations, movement speed and/or acceleration (see section 3.3.3.1, p. 64). This prediction is continuously compared with the measured data, resulting in an iterative update of the movement model, which minimizes the mean squared error. Thus, using the continuously updated state estimate (=position) instead of the actual measured position leads to a smoothed pointer behaviour that is less sensitive to hand jittering as well as technological noise e.g., caused by optical tracking.
To date, we are not aware of a systematic investigation that compares and ranks these smoothing approaches. All authors report a general improvement, but eliminating noise for pointing movements without introducing a certain time lag and thus reducing the responsiveness of the pointing device seems to be impossible for such reactive methods. It is even questionable whether or not perfect jitter compensation would, on its own, provide sufficient pointing accuracy. Thus another factor needs to be considered: human motor precision.
4.1.2 Human Motor Precision
Absolute pointing devices are characterized by a position-to-position mapping. The user expects that the cursor is in line with the device e.g., a laser pointer. Hence, the pointer motion in display space is proportional to the movement in motor space. When interacting from a greater distance, for example in a presentation situation or when using a high-density display, the effective pixel size on the display might fall below human motor precision. In such a case, even if the tremor compensation worked perfectly, the user would not be able to move discretely one pixel at a time because of limited hand-eye coordination, restricted motor precision, and the necessary but unachievable fine control of the muscle groups involved in the movement (see [Balakrishnan & MacKenzie 1997] and [Card et al. 1991] for a more detailed discussion). When using a relative input device such as a mouse, the human precision limit can be overcome by lowering the Control-Display gain (CD gain = velocityPointer / velocityDevice) [Gibbs 1962]. The CD gain modulates the mapping between the physical input device and the virtual display pointer. With a low-gain transfer function the pointer velocity in display space is several times slower than the actual velocity of the pointing device in motor space. Thus, low CD gain allows for precise targeting even in the case of high-density displays or distant interaction. On the downside, moving long distances is highly inefficient. This speed-accuracy trade-off can be solved by varying the CD gain during interaction. This approach is the basis for several interaction techniques that operate in motor-space and was also the fundamental design principle underlying our Adaptive Pointing technique.
We will discuss these different techniques according to a classification scheme which we have developed. We distinguish between target-oriented, manual-switching, and velocity-oriented approaches. Target-oriented techniques basically use a metaphor approach based on magnetism or stickiness by lowering the CD gain when the pointer either enters a target (e.g., [Hudson et al. 1997], [Cockburn & Firth 2003]) or when it comes close to a target, thus creating a fisheye effect in motor space (e.g., [Baudisch et al. 2005], [Blanch et al. 2004]). As a precondition, however, a semantic knowledge of the environment is required, and having to deal with large numbers of targets can be problematic.
Manual-switching approaches rely on the user to manually switch between absolute and relative pointing when appropriate. Forlines et al. [2006] rely on this approach with their HybridPointing concept, which provided a two-mode interaction technique with manual switching for pen input on a large, high-resolution display. In this case switching to relative mode was realized by tapping in a Trailing Widget. Lifting the pen off the display or clicking on the cursor reactivated the absolute mode. They also compared the HybridPointing technique with an exclusively absolute and an exclusively relative pen input. Overall, there was no significant main effect in terms of selection time, but a significant effect on error rate was observed. Hybrid input was worst with an error rate of 6.8% versus 4.3% for the absolute mode and 3.9% for the relative mode. The Trailing Widget, which was used for switching the mode, turned out to be “distracting” and sometimes “in the way”. Vogel & Balakrishnan [2005] defined different hand postures to explicitly switch between absolute and relative mode in their freehand pointing technique. The user thereby changes the CD gain manually between a constant value for absolute mode and a conventional acceleration function for relative mode. Vogel et al. compared this two-mode technique named RayToRelative with a solely absolute (RayCasting) and a solely relative mode (Relative). They reported that RayCasting was significantly faster (mean time 2843 ms vs. 3926 ms for Relative and 3744 ms for RayToRelative), particularly so for large targets and when clutching would have been required. However, there was a significantly higher error rate for the absolute RayCasting with a mean error of 22.5% compared with 3.5% (Relative) and 5.7% (RayToRelative). The mean error rate for absolute input even increased to 56% for the small target (16 mm) condition. Thus, the combination of absolute and relative mode turned out to be a good balance between accuracy and pointing speed. On the downside, the cognitive and physical burden of switching explicitly between the two modes remained with the users.
The third group, the velocity-oriented approaches, are motivated by the optimized-submovement model [Meyer et al. 1988], which states that most aimed movements consist of an initial, large and fast movement towards the target followed by a few slower, corrective movements to compensate for over- or undershooting [Balakrishnan 2004]. The movement velocity in motor space indicates which phase of the movement the user is in, and which degree of precision or velocity in display space should be beneficial. This is the basis of all pointer-acceleration techniques already widely in use, for example by default in Mac OS X and Windows XP [Microsoft Corporation 2002]. In research, different acceleration functions have been investigated, for example discrete switches between constant gain levels dependent on the movement velocity, linear acceleration functions, or non-linear mappings. However, the experimental results concerning possible performance improvements in these diverse functions and also in comparison with constant CD gains are inconclusive (see [Casiez et al. 2008] for a detailed discussion). Based on this approach, Frees et al. introduced the PRISM technique which dynamically adjusts the CD gain between the hand and the controlled object in a virtual 3D environment [Frees et al. 2007]. Results of evaluation studies have shown a clear improvement in pointing accuracy as compared to a pure absolute mapping.
The results confirm the impression that combinations of absolute and relative input modes seem to be able to improve pointing accuracy – but only at a price. The drawback of all these approaches is that an absolute pointing device would no longer maintain the characteristic 1:1 mapping between the device position in motor space and the pointer position in display space. This however would lead to an unnatural and unpredictable behaviour. Manual-switching approaches try to resolve this by letting the user choose between absolute and relative mapping while target-oriented approaches rely on semantic knowledge of the environment, which might not always be available. Precise pointing with an absolute input device therefore remains an unsolved problem. In the following section, we discuss our new approach to solving this issue, the Adaptive Pointing technique.
4.2 Adaptive Pointing
We introduce the Adaptive Pointing technique, which can also be classified as a velocity-oriented approach, relying on the optimized-submovement model of Meyer et al. [1988] discussed above. It differs however from similar concepts, such as PRISM, in that it simulates absolute pointing behaviour. The basic idea is to improve pointing performance for absolute input devices by implicitly adapting the CD gain to the current user’s needs without violating the users’ mental model of absolute-device operation. Users expect a 1:1 mapping between their device movement in motor space and the resulting pointer movement in display space when using an absolute pointing device. Adaptive Pointing appears to provide this pure absolute behaviour but imperceptibly lowers the CD gain when higher precision is needed [König et al. 2009a].
While PRISM works very well in the dedicated virtual environment for professional users, it has some obvious drawbacks when applied to a more general setting of (simulating) absolute pointing devices. Since the system explicitly visualizes the offset between display space and motor space movement, the device no longer appears to be an absolute pointing device to the user. This also reduces the intuitiveness and ease of use of the device, as the user initially has to understand how this gap between motor space and display space arises and how to deal with it. The absolute pointing behaviour is furthermore flawed by the necessary offset reduction. PRISM increases the CD gain by the amount needed to nullify the offset within a period of about one second. This, however, should result in a noticeable ‘jumping’ which would lead to unnatural and unexpected behaviour. Furthermore, for changes in the direction of movement, it might be that the pointer in display space is actually ‘in front’ of the motor space movement. In such a case PRISM lets the users catch up the offset by themselves, which results in a non-movement of the pointer in display space. Again, this behaviour results in a reduced ease of use and general counter-intuitiveness when applied to the more generic setting of an absolute pointing device.
Comparing Adaptive Pointing with manual-switching approaches, for example [Vogel & Balakrishnan 2005], [Forlines et al. 2006], the user is not explicitly involved in the gain variation and thus does not need to decide which technique would be most suitable for the next task. Unlike target-oriented approaches such as [Baudisch et al. 2005] and [Blanch et al. 2004], Adaptive Pointing does not require any knowledge of the displayed information or active elements. However, it can be easily combined with visual interaction techniques such as expanding targets [McGuffin & Balakrishnan 2002] or Drag-and-Pop [Baudisch et al. 2003], as well as hand-tremor compensations (e.g., Kalman filter) if further pointing and selection improvement is desired.
4.2.1 Adaptive Gain
The Adaptive Pointing technique dynamically
adjusts the CD gain depending on the movement velocity and the current offset
between the motor-space position and display-space position. Figure 39 shows the behaviour for the
velocity factor. As soon as a predefined minimal velocity threshold is met, the
CD gain is smoothly decreased. We describe this behaviour in the following
equations, but only for the horizontal case indicated by the index ![]() .
Vertical movement is calculated analogously. The first step of the iterative
position mapping between motor and display space is the determination of the
movement velocity in motor space, which serves as an indicator of the user’s
need and as the main controlling factor (see Equation 3). The velocity may be calculated as a current velocity
.
Vertical movement is calculated analogously. The first step of the iterative
position mapping between motor and display space is the determination of the
movement velocity in motor space, which serves as an indicator of the user’s
need and as the main controlling factor (see Equation 3). The velocity may be calculated as a current velocity ![]() or
as an average of the velocity over a predefined time span in order to minimize
measurement noise
or
as an average of the velocity over a predefined time span in order to minimize
measurement noise ![]() . To facilitate a flexible parameter combination, the velocity is
normalized between 0 and 1 whereby the upper and lower limits define the
interaction technique behaviour (see Equation 4). The upper limit is
. To facilitate a flexible parameter combination, the velocity is
normalized between 0 and 1 whereby the upper and lower limits define the
interaction technique behaviour (see Equation 4). The upper limit is ![]() ,
which marks the threshold from which the CD gain decreases until the lower
limit
,
which marks the threshold from which the CD gain decreases until the lower
limit ![]() is reached. Velocities below
is reached. Velocities below ![]() and above
and above ![]() are also limited to a value range of 0 to 1.
are also limited to a value range of 0 to 1.

Figure 39: Smooth transition between relative and absolute CD gain of Adaptive Pointing based on the sine wave as damping function (simplified illustration) [König et al. 2009b].
![]()
Equation 3: Velocity of the movement in motor space. For ![]() the
velocity is averaged over a predefined time span (e.g. 50 ms), which could be
used to minimize measurement noise.
the
velocity is averaged over a predefined time span (e.g. 50 ms), which could be
used to minimize measurement noise.

Equation 4: Velocity parameter – normalization of the
velocity based on the parameters ![]() and
and ![]() .
.
Since we want to ensure an absolute pointing behaviour, it is important that the offset between the position in motor space and in display space is considered as well. Equation 5 describes the offset calculation and the normalization is done analogously to the velocity normalization (see Equation 6). The basic concept enables higher fine control (CD gain < 1) for slow movements as long as the deviation is not large enough such that the user gets irritated. However, if the user wants to aim precisely at a target and thus hovers or dwells over a button, for example, an optimum of fine control should be provided independently of the current offset (see parameter combination in Equation 9). The identification of such a dwelling situation (temporary need for maximum precision) is based on the mean deviation of the current pointing position from a plurality of previous pointing positions (see Equation 7 and the normalization of the dwelling parameter in Equation 8).
![]()
Equation 5: Offset calculation – deviation between measured position and the last modulated position.

Equation 6: Deviation parameter – normalization of
the offset based on the parameters ![]() and
and ![]() .
.

Equation 7: Calculation of the dwelling that
identifies situations where high precision and very smooth interaction is
needed. The dwelling is determined by the mean deviation of the current
pointing position from the last ![]() pointing
positions.
pointing
positions.

Equation 8: Dwelling parameter – normalization of the
mean dwelling deviation based on the parameters ![]() and
and ![]() .
.
![]()
Equation 9: Parameter combination – the velocity parameter (conceptually the main parameter) can be overruled by the deviation parameter. The dwelling parameter can further adjust the function when higher precision is needed.
Since we want to avoid abrupt switches during the transition from constant gain (absolute mapping) to varying gain (relative mapping), we use a modulated sine wave as a damping function (see Equation 10). When the user decreases speed to aim at a target, the CD gain is smoothly adapted by the modulated sine wave until the minimum gain is reached or the user increases the movement speed again. When the CD gain is lowered, however, the pointer moves more slowly in display space than the input device in motor space. This results in an offset between the detected pointing position and the modulated pointer position. In case of either a high velocity or a large offset, the gain calculation reaches values above 1 up to a predefined maximum.
![]()
Equation 10: CD gain evaluation function with sine
wave as damping function bounded between ![]() (minimum
CD gain value) and
(minimum
CD gain value) and ![]() (maximum
CD gain value).
(maximum
CD gain value).
The case that the pointer position in
display space lags behind the position in motor space results in a smooth
catch-up. For the opposite case in which the position in display space is ‘in
front’ of the position in motor space (e.g., due to a change of direction) we
flip the part of the sine wave which applies CD gain>1 at the CD gain=1.0
axis (see Equation 11). Thereby
we reach a gain value slightly below 1 which allows a reverse catch-up of the
offset. The new pointer position in display space is then calculated by
applying the current CD gain, ![]() , as a factor to the last movement in motor space (see Equation 12) and adding this to the last
position
, as a factor to the last movement in motor space (see Equation 12) and adding this to the last
position ![]() in display space (see Equation 13).
in display space (see Equation 13).
![]()
Equation 11: Modulation of the CD gain for smooth offset recovery.
![]()
Equation 12: Calculation of the last movement in motor space.
![]()
Equation 13: Incremental calculation of the new pointer
position in display space based on the last movement in motor space ![]() multiplied by the modulated CD gain
multiplied by the modulated CD gain ![]() .
.
This approach allows for smooth and
continuous pointer movement that is regulated by parameters for the maximum and
minimum values of the CD gain, the movement velocity, and the offset between
display- and motor-space. As pointed out before, this is an important
difference to approaches like the PRISM technique, which does not consider the
size of the offset but instead only the velocity of the movement. We applied
Adaptive Pointing to our laser pointer interaction technology at a 221 inches
large, high-resolution display (Powerwall of the University of Konstanz) to
explore the potential as well as the constraints of the novel interaction
technique. This is obviously a very demanding setting for absolute pointing
techniques, since the user has to point at, select and manipulate very small
objects from a distance of several meters (e.g., the Windows start button is
only 22mm in height on such a display). Through iterative testing and
configuration we found the following parameters to most appropriate for this
setting: ![]() = 0.0028m/s,
= 0.0028m/s, ![]() =
0.0312m/s,
=
0.0312m/s, ![]() = 47 pixels,
= 47 pixels, ![]() = 232 pixels,
= 232 pixels, ![]() = 0.032, and
= 0.032, and ![]() =
1.055. Figure 39 illustrates
the resulting CD gain with respect to the velocity of the input device in motor
space for these parameters.
=
1.055. Figure 39 illustrates
the resulting CD gain with respect to the velocity of the input device in motor
space for these parameters.

Figure 40: Flow-chart of the Adaptive Pointing algorithm.
4.2.2 Evaluation
To evaluate the Adaptive Pointing technique we conducted a controlled experiment with 24 participants. As a popular representative of an absolute pointing device we used our infrared laser pointer interaction technology that is described in more detail in section 3.3 (p. 59) or in [König, Bieg, Schmidt, et al. 2007]. We compared the Adaptive Pointing technique with Kalman filter enhanced absolute pointing in terms of efficiency, effectiveness and user satisfaction. Additionally, we compared novices with experienced users of the laser pointer interaction technology to assess whether the usefulness of the Adaptive Pointing technique diminishes with increasing familiarity with the device.
4.2.2.1 Materials & Participants
The experiment was conducted in front of the Powerwall of the University of Konstanz (see Figure 41, a wall-sized display with a resolution of 4640 × 1920 pixels and physical dimensions of 5.20 × 2.15 meters). The infrared (thereby invisible) laser pointer interaction technology is used to interact freely with the display. We applied a combination of static and dynamic Kalman filters for the absolute pointing condition; while for the Adaptive Pointing technique we relied solely on a static Kalman filter since the Adaptive Pointing technique replaces the dynamic component. In both cases we optimized the performance as well as the ‘feeling’ of the laser pointer by iterative testing and configuration. The laser pointer was equipped with a button, which was used to click on a target. Demographic data was collected via a pre-test questionnaire. A questionnaire/interview combination was used to assess users’ subjective opinions about the Adaptive Pointing technique.

Figure 41: Comparing absolute input and Adaptive Pointing at a large, high-resolution display. Device: infrared laser pointer, distance: 3 meters.
For the study we selected 24 subjects; 16 female and 8 male. Their ages ranged from 16 to 53 years (mean 26.75, st.dev. 8.81 years). Their fields of occupation varied greatly, encompassing school pupils, university students and employees. Twelve participants formed the experienced group. They qualified for this group by having already used the laser pointer with absolute pointing extensively in an earlier study (it took place on average 52.17 days earlier, 3.01 days st. dev.). None of the other twelve subjects (novice group) had ever used an interactive laser pointer before.
4.2.2.2 Tasks
We used a ‘bubble’ task that essentially implements a discrete, multidirectional tapping paradigm to assess the pointing performance of the two different techniques (see Figure 41). In such a task, users had to move the cursor (in the form of a cross-hair) onto a randomly appearing bubble target and click the button while over it. Between each trial users had to dwell on a homing position located in the centre of the screen until the next target appeared. The task is largely along the lines of Fitts’ Law experiments, as recommended by ISO-9241-9 with the differences being the use of a discrete tapping paradigm and the use of colours and sounds for motivational reasons (see [Bieg 2008] for a discussion). We used target widths (W) of 20, 40 and 80 pixels (22.4, 44.8 and 89.6 mm respectively). These appeared in home-to-target amplitudes (A) of 400, 1000, and 1800 pixels. An initial task fulfilled the dual roles of retention task for the experienced group and training task for the novice group. In this case we used target sizes of 40, 80 and 160 pixels and a different colour setting to distinguish this training task from the experimental task. Participants used only the absolute pointing technique in this phase. Similar to [Myers et al. 2002], we used an additional dwelling task in order to assess the steadiness of the Adaptive Pointing technique, i.e., the stability with which one could hold a certain position. Users had to point at a 20-pixel target located in the centre of the screen for five seconds, while measuring started one second after first crossing the target border. Each second was indicated with a short ‘beep’ sound.
4.2.2.3 Experimental Design
We used a 2x2x3 split-plot design, the first being a between-subjects factor (experience) and the latter two within-subjects factors (pointing technique, type of task). We fully counter-balanced the pointing-technique factor across the two experimental tasks (bubble + dwelling), leaving of course the training/retention task at the beginning unaffected. This resulted in four different experimental groups to which we randomly assigned six participants each. The dependent variables were error rate (hit or miss), movement time (time between leaving the homing position and clicking on a target), and subjective rating of the technique (on a 6-point scale in terms of improvement or worsening, depending on the sequence of presenting the pointing techniques). We used of 3W(width)×3A(amplitude)×16trials×2blocks and an additional short familiarization phase of 3W×3A×5trials for each of the two pointing technique conditions. Together with 216 training/retention trials this sums up to 882 trials per participant and 21,168 trials in total. The dwelling task was repeated five times by each user for each pointing technique. Figure 42 illustrates the exact procedure.

Figure 42: Illustrating the (counter-balanced) experimental procedure – each pointing technique consisted of one familiarization block and two experimental blocks.
It is important to note that participants were not informed of the condition change between absolute and adaptive pointing. Between each block, participants were able to relax for about one minute. After completing all tasks the participants were then compensated for their efforts with a payment of 8 Euros. Each session lasted about 70-90 min.
4.2.2.4 Hypotheses
Based on our goals and design principles for the Adaptive Pointing technique we formulated the following hypotheses for our experiment. We focused on the general measures of movement time and error rate in order to distinguish between accuracy and efficiency.
· H1: Accuracy - aiming and hitting. Using the Adaptive Pointing technique will enable better aiming at and hitting of targets compared with that obtained using absolute pointing. This will manifest in a lower error rate during the bubble task and in lower deviations from the target during the dwelling task. When aiming at a target, users will slow down their movement thereby enabling the Adaptive Pointing technique. When using absolute pointing, earlier studies suggest error rates of about 15% [König, Bieg, Schmidt, et al. 2007] and dwelling deviations between 7.3 and 8.9 mm [Myers et al. 2002]
· H2: Moving. Regarding the movement time we expected the Adaptive Pointing technique to perform on a level comparable with that of absolute pointing. Since moving long distances is normally done at a higher speed [Meyer et al. 1988], the CD gain should remain comparable with pure absolute pointing and therefore should not affect the movement. However, since the measure ‘movement time’ includes the time for actually aiming and clicking, we expected the movement time for small targets to be lower compared with the times for absolute pointing. The latter should need more time in the aiming phase in order to achieve a hit, especially when the targets are only 20 pixels in width.
· H3: Imperceptibility. Since participants were not informed of the change in conditions between absolute and adaptive pointing, we assumed that participants would either not recognize a change in the behaviour of the laser pointer or not ascribe it to the laser pointer itself. The post-test questionnaire explicitly asked about any kinds of change noticed during the experiment in terms of accuracy, ease of use, and performance as well as the reasons that people claimed to be responsible for these changes. One design rationale behind the Adaptive Pointing was to integrate an imperceptible change in CD gain, preserving the feeling of a pure absolute pointing device. According to a study by Sutter et al. [2008], people tend to judge their hand movement mainly on the basis of the on-screen movement of the cursor; they then adapt their hand movement accordingly. This means that, as long as the discrepancy between cursor position and hand position is quite small, people will not recognize any discrepancy at all and therefore will not ascribe the different accuracies of per-se absolute pointing devices to the devices themselves.
· H4: Experience. This last hypothesis assumed that people with more experience would 1) perform better than the novice group and 2) benefit less from the Adaptive Pointing in terms of the first two hypotheses. While the first point should be due to the larger amount of training producing positive results, as has been discovered before (see [Bieg 2008]), the second point reflects the thinking that a higher level of performance (due to training) naturally leads to less room for improvement.
4.2.2.5 Results
For further analysis and testing of our hypotheses we considered the 13,824 trials during the bubble task. In a first step, we removed 1.7% of these trials after identifying them as either accidental clicks or extreme outliers resulting in 13,578 trials used for analysis. Furthermore, one participant (in the experienced group) was completely excluded because of error rates higher than 25% regardless of the pointing technique. During the interview he stated that he didn’t really try to hit the targets. Homogeneity of variances was achieved in all cases when contrasts or pair-wise comparisons were performed.
H4: experience: We begin the presentation of the results with our last hypothesis, which stated that experienced users would perform better, and benefit less from the Adaptive Pointing technique, when compared with the novice group. Results, however, show that both groups performed fairly equally. Table 6 shows that the small differences are non-significant.
|
|
Error rate/std.err. (in %) |
Movement time / std. err. (in s) |
|
Novice |
11.26/1.49 |
1.67/0.74 |
|
Expert |
8.8/1.45 |
1.72/0.87 |
|
F-statistic |
F(1,21)=1.365, p=0.256 |
F(1,21)=0.430, p=0.519 |
Table 6: Comparing experience levels of the participants.
We therefore have to withdraw the hypothesis in favour of the null-hypothesis. This result is somewhat surprising. An analysis of the retention task in comparison to the earlier study reveals that although the performance of the experienced participants decreased by about 5%, they were still superior to the novice group (about 16%), although the difference is not significant (p=0.069). Nevertheless, this might indicate that the increased difficulty of the bubble task made the training obsolete. In future studies we will investigate the influence of task difficulty on learning more in detail. Based on these findings we do not report the following findings with respect to different experience levels.
H1: accuracy (aiming & hitting): We first analyzed the error rate during the bubble task. A 2(exp.)×2(pointing technique) Repeated-Measures(RM)-ANOVA (measure: error rate) shows a significant main effect for pointing technique (F(2,20) =42.836, p=0.000). Post-hoc pair-wise comparisons (with Bonferroni adjustments) reveal that the error rates differ significantly in favour of the Adaptive Pointing technique (5.4% compared with 14.77%, std. err.: 0.7% for adaptive and 1.79% for absolute, p=0.000; confidence intervals (95%) for error rate: 3.93%-6.82% (adaptive) vs. 12.24%-17.13% (absolute)). Given the confidence intervals, this is a reduction of between 44.29% and 77.07% (mean: 63.44%). This is further reinforced by the very large effect size of etap²=0.784. The influence of the target widths was analyzed in more detail (see Figure 43). We see that the difference is especially apparent for the 20- and 40-pixel targets (pair-wise comparison significant, p=0.000), while it is non-significant for the 80-pixel targets (p=0.653). The presentation sequence of the pointing techniques actually had a significant effect on error rate (F(1,18)=9.396, p=0.001). However, detailed analysis showed that it influenced the results in favour of the absolute pointing technique – while the Adaptive Pointing technique significantly decreased in performance when presented second (error rate: 7.22% compared with 3.73%, F(1,20)=8.256, p=0.009), the absolute condition benefited (error-rate: 11.08% compared with 18.79%, F(1,20)=19.304, p=0.000). Our results therefore tend to show the lower bound of the actual difference.

Figure 43: Comparing error rates for different target widths (bubble test).
The dwelling task showed similar results. While users could point to the target with a mean deviation of 4.72 pixels when using the Adaptive Pointing technique, they only managed a mean deviation of 7.99 pixels with absolute pointing (see Figure 44, main effect of pointing technique: F(1,23)=63.191, p=0.000). In using a 20-pixel target and not just a single dot, we assumed participants might not have tried to point to the centre but instead just to stay within the boundaries of the target. We therefore calculated the individual centre of the pointing a-posteriori for each participant × trial and the deviation around this centre. The results are similar again (see Figure 44, 3.1 pixels vs. 7.0 pixels, F(1,23)=119.559, p=0.000). In short, both the bubble test and the dwelling test strongly support the accuracy hypothesis.

Figure 44: Comparing dwelling deviations with respect to the target centre (left) and to an individual centre (right).
H2: moving: The second hypothesis stated a decreased movement time for the Adaptive Pointing technique only for small targets due to the fact that this measurement also includes clicking on a target. Looking at the results shows that it did indeed take participants only 1.49 seconds to reach a target and click on it when using Adaptive Pointing compared with 1.84 seconds for absolute pointing. Accordingly, an RM-ANOVA shows a large main effect for pointing technique (F(1,23)=58.468, p=0.000, etap²=0.736). Again, we analyzed the width × pointing technique interaction in detail to investigate the influence of the different target widths (see Figure 45). This time, the differences between the two techniques remained significant (pair-wise comparisons, p=0.000) in all cases – the size of the effect, however, decreases with increasing target width. This is in line with the results of the previous hypothesis in that the benefit of Adaptive Pointing is particularly evident when having to click on small objects. To sum up, the results clearly support the stated hypothesis and show that Adaptive Pointing is more efficient even for larger target sizes of 80 pixels (89.6mm).
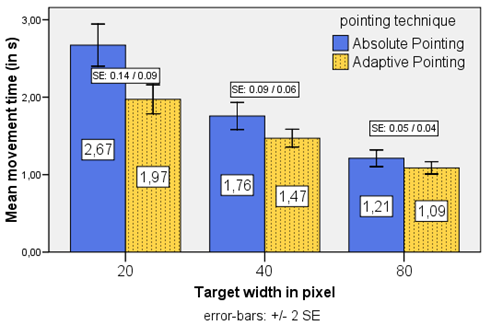
Figure 45: Comparing movement times for different target widths (bubble test).
H3: imperceptibility: The third hypothesis stated that users would not recognize the change in pointing technique during the experiment or at least would not ascribe it to the laser pointer itself. Only three users did not recognize any change at all, clearly contradicting the first part of the hypothesis. The remaining 21 participants filled in a questionnaire asking them to define the change experienced during the experiment in more detail by agreeing with statements such as ‘Usage got more/less tiresome’, ‘It was easier/harder to hit the targets’, or ‘I got better/worse’. Because we had varied the presentation sequence of the pointing techniques, we had a positive and a negative version of each statement. It is important to note that users could choose freely from the list of statements and were not asked to answer each of them. For analysis of the data, we then counted how many positive statements a technique received for each question. Negative statements were transformed into positive points for the competing technique. The resulting Figure 46 reveals that users clearly assigned the positive statements to the Adaptive Pointing technique.

Figure 46: Comparing subjective user ratings of the 21 participants who recognized the switch between absolute pointing and adaptive pointing.
A Chi² test shows that the difference in distribution of the statements between techniques is significant for each case (getting better: X²(1,N=18)=10.889, p=0.001; less tiresome: X²(1,N=16)=4.0, p=0.046; easier to aim: X²(1,N=16)=9.0, p=0.003; easier to hit: X²(1,N=18)=8.0, p=0.005). When asked what might be responsible for the change that they had recognized, participants gave fatigue as the reason for getting worse (7 times) while changes to the laser pointer itself (7 times), results of practice (4 times) or an improvement in mental concentration (2 times) were reported as responsible for performance improvements. In addition to the above-mentioned statements, the 21 users who noticed a change had to give a total rating on a six-point scale, stating whether the change was for the worse or for the better. We transformed this scale so that ratings higher than 3.5 favoured the Adaptive Pointing while values lower than 3.5 rated it as worse. The mean rating was 4.67 with a std. deviation of 1.197. A one-sample t-test (two-sided) reveals that this is a significant difference from the 3.5 test value (t(20)=4.466, p=0.000).
To sum up this hypothesis, our initial concern, namely that recognition would mean that the laser pointer behaved unnaturally, turned out to be wrong. Our participants clearly ascribed positive characteristics to the Adaptive Pointing technique and rated it as significantly better than absolute pointing.
4.3 Summary
In this chapter we addressed the imprecision of absolute pointing devices, focusing particularly on the case of interacting from distant positions. This issue is critical when interacting with LHRDs due to users’ increased physical navigation and the high display resolutions. We identified users’ natural hand tremor and limitations in human motor precision as restricting factors for the interaction performance. In order to more clearly discriminate between existing approaches, we introduced a new classification scheme for precision enhancing pointing techniques and discussed work and literature related to this classification. Following the design space classification introduced in section 3.2 (p. 41), we developed a novel interaction technique in this chapter – Adaptive Pointing[30] – which improves interaction performance based on a dynamic optimization of the transfer function. The intention behind this approach is to improve pointing performance for absolute input devices by implicitly adapting the Control-Display gain to the current user’s needs without violating users’ mental model of absolute-device operation. In order to evaluate the Adaptive Pointing technique, we conducted a controlled experiment comparing Adaptive Pointing with pure absolute pointing. In this study the laser pointer introduced in the previous chapter was used as an example of an absolute device. The experiment provided some clear-cut results. In every single aspect, the Adaptive Pointing technique proved to be significantly better than a Kalman filter enhanced absolute pointing. We observed a mean reduction in the error rate (effectiveness) of about 63%, an improvement in dwelling deviation of between 40% and 55%, as well as more efficient usage in terms of movement time (19% mean difference). Furthermore, users stated that they clearly preferred the Adaptive Pointing and assigned positive characteristics such as “better hitting” or “less exhausting” to it. Putting the results in perspective, we can for example compare the dwelling results with the study of Myers et al. [2002]. In a similar setting they noted a deviation of between 7.3 mm and 8.9 mm, which corresponds approximately to our observed deviation of 7.99 pixels (=8.95 mm) for absolute pointing, while Adaptive Pointing resulted in a deviation of only 4.72 pixels (=5.29 mm). With regards to efficiency and effectiveness, former approaches suffered a clear speed-accuracy trade-off [Vogel & Balakrishnan 2005], while our Adaptive Pointing outperformed in both aspects. To conclude, we would like to cite our participants, firstly on the behaviour of Adaptive Pointing: “No, it was no big readjustment by any means. It [Adaptive Pointing] was very helpful and happened without any problems. By itself.”(ID12), and secondly on its effect: “In the beginning [absolute pointing] I found it exhausting but towards the end [Adaptive Pointing] I almost found it boring. Because then you hit almost every time.” (ID24).
5 Interactive Design of Multimodal User Interfaces
![]() Contents
Contents
5.2 Squidy Interaction Library
5.2.3 Formative Evaluation Study
In the previous chapters we presented an input device and an interaction technique designed to fulfil the particular requirements of users interacting with large, high-resolution displays. In the following chapter we will not discuss further devices but rather focus on the design and development process in general. As we experienced in our own research, the development of new interaction modalities such as input devices and interaction techniques is very challenging, since it is less supported by common development environments and requires very in-depth and broad knowledge of diverse fields such as programming, signal processing, network protocols, hardware prototyping, and electronics. For multimodal interfaces several input modes have to be combined technically as well as conceptually, such as speech, pen, touch, gaze, and body movements (see Figure 47 for some examples), all coordinated with multimedia system output [Oviatt 2008]. The development of multimodal interfaces even increases the already high level of complexity of the development of a single mode input device. However, multimodal interfaces offer great potential for enriching the human-computer interaction, particularly in the context of LHRDs by utilizing more human senses and interaction capabilities.
In the following, we present a three-part approach to supporting interaction designers and researchers in designing, developing, and evaluating novel interaction modalities including multimodal interfaces. First, we present a software architecture that enables the unification of a great variety of very heterogeneous device drivers and special-purpose toolkits in a common interaction library named ‘Squidy’. Second, we introduce a visual design environment that minimizes the threshold for its usage (ease-of-use) but yet scales well with increasing complexity (also defined as “ceiling” [Myers et al. 2000]) by combining the concepts of semantic zooming with visual dataflow programming. Third, we not only support the interactive design and rapid prototyping of multimodal interfaces but also provide advanced development and debugging techniques to improve technical and conceptual solutions. Additionally, we offer a test platform for controlled comparative evaluation studies as well as standard logging and analysis techniques for providing information for the subsequent design iteration. Squidy therefore supports the entire development lifecycle of multimodal interaction design, in both industry and research [König et al. 2010].

Figure 47: Diverse input devices for single-modality or multimodal interfaces: (a) Physical game controllers offer absolute pointing, motion sensing and gesture-recognition to the end-user. (b) Digital pens build upon users' pre-existing knowledge and thus offer a very natural mode of interaction e.g., for digital sketching and prototyping. (c) Multi-touch surfaces augmented with physical tokens reduce the gap between real-world and digital-world interaction. (d) Finger gestures provide a very expressive and direct mode of interaction. (e) Well-known devices such as an omnipresent laser pointer provide flexible input from any distance.
5.1 Related Work
In contrast to the design of traditional graphical user interfaces, the development of multimodal interfaces and new input devices in general involves both software and hardware components [Harper et al. 2008]. However, conventional development environments (e.g., Microsoft Visual Studio[31], Adobe Flash[32], Eclipse IDE[33]) fail to support uncommon interaction modalities nor do these support appropriate data processing techniques (e.g., for computer vision), not to mention the handling of multipoint and multi-user applications (e.g., for multi-touch interaction). As a consequence a broad variety of very heterogeneous and specialized toolkits and frameworks have evolved over the last few years for example, Apple iPhone SDK[34], Microsoft Surface SDK[35], GlovePIE[36], Processing[37], NUI Group Touchlib[38]. They provide support for specific interaction modalities, but are mostly restricted to a dedicated hardware environment and entail further requirements and dependencies. When using touch as input for instance, the interaction designer has to cope with different hardware platforms, operating systems, programming languages, and software frameworks (see Table 7). When developing single-modality interfaces, this diversity can be bypassed – at least in the short-run – by focusing on just one specific device. But the combination of multiple devices for multimodal interaction involves further platforms, devices, and frameworks, resulting in an unmanageable technical and mental complexity.
|
Hardware platform |
Microsoft Surface |
Custom-build table |
Apple iPhone |
HTC Hero |
|
Form factor |
table |
table |
mobile |
mobile |
|
Operating system |
Microsoft Windows |
Linux / Windows |
Mac OS X |
Android OS |
|
Programming language |
C# |
C++ |
Objective-C |
Java |
|
Software framework |
Surface SDK |
Touchlib |
iPhone SDK |
Android SDK |
Table 7: Interaction designers have to cope with very different environments for the same interaction modality, touch input.
There are development environments that support at least some of the more uncommon input devices and modalities (e.g., physical turntables, mixing desks, multi-touch surfaces and simple vision tracking). Two examples are Max/MSP[39] and vvvv[40]. Both are graphical development environments for music and video synthesis and are widely used by artists to implement interactive media productions. Their popularity in the design and art community arises in particular from their graphical user interface concepts. Both are based on the concept of visual dataflow programming and utilize a cable-patching metaphor to lower the implementation threshold [Myers et al. 2000] for interactive prototyping. Users arrange desired components spatially and route the dataflow between the components by visually connecting pins instead of textual programming (see Figure 48). However, the visual representation of each primitive variable, parameter, connection, and low-level instruction (e.g., matrix multiplication) leads to complex and scattered user interfaces, even for small projects. vvvv and Max/MSP offer the possibility of encapsulating consecutive instructions in so-called "subpatches" (see Figure 49). This approach helps to reduce the size of the visual dataflow graph, but the hierarchical organization introduces additional complexity. In contrast to the visual encapsulation, the "external" mechanism of Max/MSP supports the visual and technical encapsulation of certain functionality in an external object as a "black-box". This mechanism offers high flexibility and abstraction but requires low-level programming in C. This results in a higher threshold for use and lower interactivity of the design and development process, since changes have to be textually written and compiled in an external development environment before the external object can be used in Max/MSP.

Figure 48: Screenshot of vvvv showing a small example application that renders a red line on a blue background where the line width is interactively specified by the current horizontal position of the mouse with respect to the GDI window (right). The context menu (grey box in the centre) is open and shows all available nodes in a scrollable list.
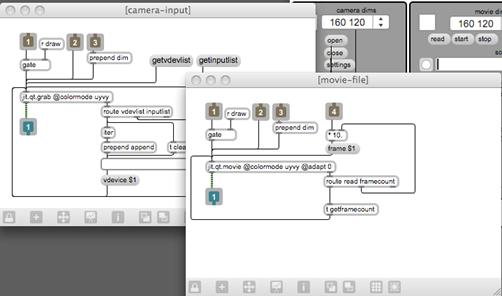
Figure 49: Screenshot of Max/MSP showing two subpatches for video input with different input sources: a camera and a movie file. See Video Processing Tutorial at http://cycling74.com/ for more details.
Basically, Max/MSP and vvvv present interesting user interface concepts but they are focused on real-time audio composing and 3D rendering and were not designed to support the development of general multimodal interfaces in general. For that, interaction designers require not only a set of ready-to-use interaction techniques and input devices but also the possibility of physically developing and integrating new interaction modalities and hardware devices. Hardware toolkits such as Phidgets [Greenberg & Fitchett 2001], Smart-Its [Gellersen et al. 2004] or iStuff [Ballagas et al. 2003] offer a set of compatible microcontrollers, sensor devices and software frameworks enabling rapid prototyping of physical input and output devices (see Figure 50). However, the technical complexity of the software frameworks requires advanced programming and signal processing knowledge, in particular when multiple devices are used in parallel.


Figure 50: Left: Highly integrated Smart-Its module providing sensors for audio, light levels, triple-axis acceleration, humidity, temperature, pressure, and LED as well as speaker output [Gellersen et al. 2004]. Right: Phidget Interface Kit Package[41] with diverse sensors and LEDs as well as an I/O board with embedded controller and USB port for data transmission and power supply.
iStuff mobile [Ballagas et al. 2007] combines the hardware toolkit iStuff with a visual programming environment based on Apple's Quartz Composer[42] (see Figure 51). This was originally designed to support the visual development of interactive multimedia and 3D rendering. It shares the cable-patching metaphor with the already discussed development environments vvvv and Max/MSP. This combination of hardware toolkit and visual development environment facilitates fast iterations and rapid prototyping on multiple levels. However, it is restricted to the domain of mobile phone interaction and limited in its functionality and the type of input (e.g., no support for computer vision).

Figure 51: “Apple’s Quartz Composer is a visual programming environment designed to support rapid creation of 3D interactive visualizations. Ballagas et al. have extended it to support prototyping physical user interfaces. This screenshot shows the development of a weather application for a large public display in a train station. The user can navigate through the different regions of the map by waving their phone through the air using the Sweep technique [Ballagas et al. 2005], and the corresponding weather data is updated live through RSS feeds”, [Ballagas et al. 2007].
All of the aforementioned development environments and toolkits support diverse devices and modalities but they were not specially designed to support the design of multimodal interfaces. Here, multiple inputs have to be synchronized (e.g., hand-gesture and speech), processed and transformed into a higher level command (e.g., moving an object). There are few frameworks that address these requirements. ICARE [Bouchet et al. 2004] is a conceptual component model and a software toolkit for the rapid development of multimodal interfaces (see Figure 52). It provides two types of software components: the elementary components, consisting of Device and Interaction Language components used to develop a specific modality, and the Composition components that combine the diverse modalities. It has been used for different use cases (e.g., design of a multimodal flight cockpit) but it became apparent that only a limited set of the defined components were really generic [Serrano et al. 2008] and that the toolkit was not easily extensible [Lawson et al. 2009].

Figure 52: Sketch of the graphical ICARE platform: A) palette of components, B) editing zone for assembling the selected components, C) customization panel for setting the parameters, D) alert box with messages related to the multimodal interaction [Bouchet et al. 2004].
Based on the experiences gained with ICARE, the open source framework "OpenInterface" was developed by the OpenInterface Project[43] which is dedicated to multimodal interaction. The OpenInterface framework is composed of the OpenInterface Kernel, a component-based runtime platform, and the OpenInterface Interaction Development Environment (OIDE), a graphical development environment for the design of multimodal interfaces [Serrano et al. 2008]. In order to integrate an existing input device as a component in the OpenInterface Kernel, the component interface has to be specified in a dedicated XML-based CIDL description language (Component Interface Description Language). This specification can be semi-automatically generated from the source code of the component by the OpenInterface platform. It also generates C++ code to encapsulate the external binary into a well defined programming interface [Benoit et al. 2007]. Due to this explicit description of the interface the encapsulated component can be used in the graphical development environment OIDE.

Figure 53: OpenInterface Interaction Development Environment (OIDE) showing a multimodal control for Google earth based on a SHAKE sensor (multi sensor device) and speech input [Gray et al. 2007].
The graphical development environment OIDE uses a cable-patching metaphor similar to Max/MSP, vvvv, and Quartz Composer in order to define the dataflow by combining the selected components visually (see Figure 53). [Lawson et al. 2009] identified diverse shortcomings of the OpenInterface OIDE and the introduced application design process. A major issue is the limited focus and inflexible design of the components. The developers tend to focus on the design of their individual component than on the application as a whole. This leads to an inflexible design of the components and the application in general that hinders the reuse, extension and exchange of components as well as the entire application. This inflexibility also restricts interaction designers in exploring diverse alternatives, which then impedes rapid prototyping and limits epistemic production [Kirsh & Maglio 1994] of concrete prototypes. In order to address these identified issues Lawson et al. introduced an all-in-one prototyping workbench for multimodal application development [Lawson et al. 2009]. It is a combination of the OpenInterface Kernel with an Eclipse Plugin as graphical editor which they name SKEMMI. The editor is also based on the cable-patching metaphor, but provides three levels of detail with respect to the displayed information. The low-detail "workflow" level reduces information and facilitates the initial sketching of the desired interaction techniques. In the "dataflow" level where all details for the routing of the dataflow are represented, the user selects, arranges and logically links the components without the need to route and connect every single pin. In a third-level, the "component" level, only a specific component with its input and output pins is visualized and the user is able to tailor the component's interface (e.g., changing the port attributes and parameters). SKEMMI provides also an alternative source code editor view that allows for changes of the component or its interface programmatically. The three-layer approach helps to control the visual and functional complexity of the components, but there is no higher-level abstraction concept (e.g., hierarchical pipelines or semantic zooming). If the designed multimodal interface incorporates multiple devices and various signal processing components, the SKEMMI user interface gets increasingly crowded. The geometric zoom of the user interface is not a solution for the complexity issue since it just changes the size of the displayed information but not the information representation itself.

Figure 54: SKEMMI Eclipse Plugin showing a design for a multimodal music player [Lawson et al. 2009].
In summary, there are only very few frameworks that support the design of multimodal interfaces. However, they either provide a limited range of interaction modalities or are hardly extensible regarding the platform, the components or the visual user interface. The OIDE or the SKEMMI graphical editors seem very promising, but the complexity issue is critical in real world projects. Moreover, all of the discussed development environments focus mainly on rapid prototyping and the early steps of iterative design. None of them provide tool-support for the empirical evaluation of the designed interfaces (e.g., ISO 9241-9 tapping tasks and suitable data-logging). All of the graphical development environments utilize the cable-patching metaphor in a similar way in order to connect input and output pins. However, the dataflow programming could be more powerful without sacrificing its simplicity. Furthermore, they still require a deep understanding of the underlying technology on behalf of the designers, since they have to understand and route each primitive variable/data item even when using "black-box" modules.
In the following, we present our Squidy Interaction Library, which contributes in the following ways:
· Software architecture: Squidy enables the unification of heterogeneous devices and components in a common library. The architecture is designed to provide flexibility, simple extension, high independency and fast parallel processing.
· Visual design environment: Squidy enables the interactive design and configuration of multimodal interfaces for interaction designers and researchers. The user interface concept is designed to provide a low threshold for learning the software (ease of learn) and a high ceiling (in terms of functionality) and scales well with increasing complexity.
· Tool-support for the entire development lifecycle: Besides the visual design and configuration for rapid prototyping, Squidy also provides advanced development and evaluation techniques for iterative design.
After giving a short conceptual overview in the next section, we will discuss the software architecture in section 5.2.1 and afterwards describe the user interface concept in detail in section 5.2.2. We investigated general usability issues of the Squidy Interaction Library in the course of a formative evaluation study which we will describe in section 5.2.3. Furthermore, we will show the appropriateness of our solution to the actual design and research process in the context of a variety of real world projects in section 5.2.4.
5.2 Squidy Interaction Library
We introduce the Squidy Interaction Library[44], which unifies a great variety of device toolkits and frameworks in a common library and provides an integrated user interface for visual dataflow management as well as device and data-filter configuration. Squidy thereby hides the complexity of the technical implementation from the user by providing a simple visual language and a collection of ready-to-use devices, filters and interaction techniques. This facilitates rapid prototyping and fast iterations for design and development. However, if more functionality and profound customizations are required, the visual user interface reveals more detailed information and advanced operations on demand by using the concept of semantic zooming. Thus, users are able to adjust the complexity of the visual user interface to their current needs and knowledge (ease of learning).

Figure 55: View of a simple pipeline in Squidy. The pipeline receives position, button and inertial data from a laser pointer, applies a Kalman filter, a filter for change recognition and a filter for selection improvement and finally emulates a standard mouse for interacting with conventional applications. At the same time the data is sent via TUIO to listening applications. The pipeline-specific functions and breadcrumb navigation are positioned on top. The zoomable knowledge base, with a selection of recommended input devices, filters, and output devices, is located at the bottom.
The basic concept which enables the visual definition of the dataflow between the input and output, is based on a pipe-and-filter concept (see Figure 55 and section 5.2.2, p. 129, for a more detailed discussion). In using this Squidy is able to provide a very simple, yet powerful visual language for designing the interaction logic. Users can select an input device as the source, e.g., a laser pointer, which is represented by an input node in the visual user interface. They connect it successively with filter nodes for data processing, such as compensation for hand tremor or gesture recognition and route the refined data to an output node as a sink. Basically, the user defines the logic of an interaction technique by choosing the desired nodes from a collection of nodes available (knowledge base) and connecting them in an appropriate order assisted by heuristic-based node suggestion. The filter nodes are independent components that can transmit, change, or delete data objects, and also generate additional ones (e.g., if a gesture is recognized). The source and sink are specific drivers that handle input / output operations and map the individual data format of the devices to the generalized data types defined in Squidy (see Figure 57). The pipe-and-filter concept also provides distinct technical advantages, since the encapsulation of functionality in independent "black-boxes" ensures information hiding, modifiability and reusability by abstraction. The possibility for multiple input and output connections offers a high degree of flexibility and the potential for massive parallel execution of concurrent nodes. In our implementation each node generates its own thread and processes its data independently as soon as it arrives. This effectively reduces the device’s processing delay that could have a negative effect on the interaction performance.

Figure 56: Input node in Squidy representing an interactive laser pointer. In order to reduce visual complexity the node-specific functions (start, stop, duplicate, delete) are only shown if the pointer is within the node.
The sink can be any output technique such as a vibrating motor for tactile stimulation or LEDs for visual feedback. Squidy also provides a mouse emulator as an output node to offer the possibility of controlling standard WIMP-applications with unconventional input devices. Multipoint applications (e.g., for multi-touch surfaces or multi-user environments) and remote connections between multiple Squidy instances are supported by an input / output node that transmits the interaction data either as TUIO messages [Kaltenbrunner et al. 2005] or as basic OSC messages over the network. TUIO is a widely used protocol for multipoint interaction based on the more general OpenSound Control protocol (OSC), which is a successor to the MIDI standard. By providing these standard interfaces for both input and output connections Squidy supports the majority of multi-touch applications that have recently become very popular in both research and industry. Beyond these basic network interfaces Squidy also supports and integrates more complex frameworks such as the Apple iPhone SDK[45], the Android SDK[46], the NUIGroup Touchlib[47], and the Microsoft Surface SDK[48]. Users therefore benefit from the particular functionalities and specific hardware of all these techniques. Inside Squidy, however, they are also able to define, control, evaluate, and reuse interaction techniques independently from the hardware or the specific framework. This flexibility results of the architecture utilized and the generalized data types which will be explained in the following section.
5.2.1 Framework Architecture
There are several frameworks and toolkits that provide ready-to-use components for input devices and signal processing. Instead of connecting the components to pipelines programmatically, most of these frameworks and toolkits offer a basic language for controlling the dataflow visually (for example Max/MSP, vvvv, OIDE or SKEMMI). Such a visual programming language reduces the technical threshold and complexity and aids users with little or no programming experience. However, the integration of new modalities requires a detailed understanding of the underlying technology and thus is still a highly demanding task. Extending a framework with new components is only offered by a few of today's common frameworks such as ICARE [Bouchet & Nigay 2004] or the open source framework OpenInterface. Integrating new components into the frameworks, however, requires either additional programming effort or a dedicated definition of the interface by a specific mark-up language. Basically this means that a developer has to switch between different applications and programming languages while developing a new interaction technique, increasing the mental workload.
5.2.1.1 Generic Data Types
In order to unify very heterogeneous devices, toolkits and frameworks, we generalized the various kinds of input and output data into a hierarchy of well-defined generic data types (see Figure 57) based on the primitive virtual devices introduced by Wallace [Wallace 1976] which were already presented in section 3.1 (p. 38). Following the inheritance concept of object-oriented programming, we defined a root class named DataObject that provides basic methods and implements the IData software interface. DataObject is extended by the child classes DataAnalog, DataPosition2D, DataDigital, and DataString. The definition of these data types are directly related to the primitive virtual devices presented by Wallace (see Table 8). Wallace used the Pick device to designate user defined visual objects such as drawn lines or curves. Basically, it is an extension of the locator device carrying instead of the position the reference of the selected or hit object. Thus it introduces a dependency to the application layer, since semantic knowledge is needed to do the hit testing and to determine the selected object. In order to achieve maximum flexibility we decided to keep the Squidy interaction library independent of the applications. Moreover, almost all current programming languages handle hit testing internally which makes the pick device obsolete today.
|
Primitive virtual devices [Wallace 1976] |
Squidy generic data types |
|
Locator |
DataPosition2D |
|
Valuator |
DataAnalog |
|
Button |
DataDigital |
|
Keyboard |
DataString |
|
Pick |
– |
Table 8: Relations between primitive virtual devices of Wallace and Squidy generic data types.

Figure 57: Data type hierarchy in Squidy based on the primitive virtual devices introduced by Wallace [1976]. Any data processed in Squidy consists of these generic data types. This hierarchy is also provided in the Squidy user interface as a data type filter on each side of a connection between nodes. Clicking on the data types activates and deactivates the filter at runtime. Deactivated filters would be white (compare with Figure 66, p. 137).
Each generic data type consists of a type-specific aggregation of atomic data types such as numbers, strings or Boolean values bundled by their semantic coherence. For example, a DataPosition2D object carries the x- and y-value, the timestamp of the input, the identifier of the source device and several other attributes. More complex inputs such as three-dimensional position and orientation of a tracking target in space are also bundled in a single data type object that extends the primitive devices such as DataPosition6D. The underlying idea is to reduce complexity for users by providing a set of well-defined generic data types and by encapsulation and hiding of the metadata. Thanks to this concept, input data can be routed by adding a single connection between two nodes in the visual user interface. This is quite a different approach when compared to some of the aforementioned frameworks such as ICARE [Bouchet et al. 2004] and vvvv. These frameworks use atomic data types defined in the particular programming language and assign them visually by connecting resultant values with function arguments in their specific user interfaces. In order to use the functionality of a module in these frameworks, the user has to route each of these low-level data types. Each x-, y-, and z-value of a three-dimensional data type has to be routed separately, for example. This procedure requires additional effort and can be error-prone, particularly when designing complex interaction techniques. Furthermore, this approach requires detailed knowledge about the functionality of each node and its arguments. Routing low-level data types therefore puts a relatively high cognitive load on the user and leads to visually scattered user interfaces, particularly as the number of connected nodes increases.
Squidy, on the other hand, does not require the designer to visually define every value and programming step manually. The interaction data is grouped in semantically bundled generic data types as mentioned before. Squidy therefore offers the abstraction and simplicity of higher-level dataflow management and reduces complexity for the interaction designer without limiting the required functionality.
5.2.1.2 Squidy Bridges
In order to achieve extensibility and to simplify the integration of new devices and applications, we provide Squidy Bridges as common interfaces that support widely used network protocols and also offer a specific native API (Application Programming Interface) if high-performance data transmission is needed. For the purpose of unifying data produced by different hardware devices or applications (especially relevant for incorporating multiple interaction modalities), Squidy Bridges map diverse data originating from heterogeneous sources to the generic data types. Thus, the internal data processing is harmonized and completely separated from the diversity of the external world. These bridges are able to handle data transformations in both directions (e.g., from an Apple iPhone into the Squidy Core and from the Squidy Core to the application running on the panoramic display and vice versa in order to close the feedback loop, for example activation of the vibrator on the iPhone as tactile feedback of the application’s status (see Figure 58)).

Figure 58: This figure shows the usage scenario of an interactive and multimodal environment for controlling an application running on a 360° panorama screen by using touch gestures and speech. The user interacts with his fingers by touching the display of an Apple iPhone (1). All recognized touches will be sent from an iPhone Client application (OSC reference implementation running on the iPhone) to Squidy’s OSC Bridge (2). The Squidy Core will process the incoming data appropriately and send it via the “special purpose bridge” (3) to the 360° application (4) to control a cursor object, which visually highlights the users current finger position. If the user selects an interactive element with a touching gesture the application (5) sends a tactile feedback back to its connected bridge (6). The tactile feedback coming from the application will be forwarded through the OSC Bridge (7) to the iPhone (8) where the vibration motor will be activated to inform the user that she is hovering above an interactive element. After the user recognizes the tactile feedback and thus the interactive element (9), she will use a spoken command to invoke an action on the selected object. The spoken command will be recognized by the operating system’s speech recognition software and then will be sent to the “native interface bridge” (10). The appropriate spoken command will have been processed by the Squidy Core (11) and transformed into an action, which will be sent to the application to trigger object activation / manipulation (12). This multimodal scenario can be implemented with Squidy using pluggable Squidy Bridges for receiving data from different devices and a simple arrangement of nodes to process that incoming data.
The interaction library comes with an OSC Bridge and a Native Interface Bridge that can be used out-of-the-box. The OSC Bridge offers the possibility of directly connecting the various available devices and toolkits using this communication protocol. Since OSC is based on standard network protocols such as UDP or TCP, it is highly flexible and widely applicable, in particular for mobile or ubiquitous computing. An OSC message consists of several arguments such as the class name of the generic data type, a unique identifier and data-type-specific parameters and attributes. An example message for a touch on an Apple iPhone is illustrated in Code Listing 1.

Code Listing 1: Example OSC Message sent from an Apple iPhone for the case of a finger touch.
The flexibility gained from this network approach (e.g. hardware and software independence, high scalability via distributed computing (see Figure 79, p. 151) entails a certain delay that can have a negative effect on user input performance [MacKenzie & Ware 1993]. Thus, for those purposes for which performance is more important than flexibility, the Native Interface Bridge provides a straightforward Java and C/C++ API to map data from individual devices to the generic data types in Squidy programmatically. In contrast to the OSC Bridge, this technique increases throughput and reduces the delay to a minimum.
For devices that support neither the OSC protocol nor the Native Interface Bridge by default, Squidy provides client reference implementations (e.g., Squidy Client for iPhone OS[49] and for Android OS[50]) that can be deployed on these devices, minimizing effort and threshold for device integration. However, if the hardware is not able to communicate via existing bridges natively, or if deployment of proprietary software is not desired or is not possible due to hardware restrictions, then users can add further bridges to allow communication, for instance through special-purpose protocol bridges such as the Virtual-Reality Peripheral Network [Taylor et al. 2001].
The support of multiple bridges as interfaces in combination with the device-independent generic data types enables a separation of the data sources and signal processing in the Squidy Core. This offers a simple but flexible integration of new interaction techniques and modalities without touching or affecting existing core functionality. As with ICARE [Bouchet & Nigay 2004] or OpenInterface, interaction techniques designed for the user interface are completely decoupled from the individual hardware or the connected applications. Replacing devices (e.g., switching from the Apple iPhone to Microsoft Surface) therefore does not affect the applied interaction techniques (e.g., “selection by dwelling”) or the concrete application also connected to a Squidy Bridge. The independent-bridge approach, in combination with the generalization of data types, enables the integration of very heterogeneous devices and toolkits within Squidy. Interaction techniques that have been defined once can be reused multiple times. Squidy thus reduces complexity by abstraction, offers high flexibility and enables rapid prototyping.
5.2.1.3 Squidy Core
All data resulting from user interaction is bridged from devices to the Squidy Core. The core processes this data automatically and in parallel without any programming effort or further customizations. Users can define a filter chain (processing chain) using visual dataflow programming provided by the visual user interface of the Squidy Interaction Library. In order to process the interaction data, the Squidy Core provides a flexible API for manipulating (CRUD – Create / Read / Update / Delete) the dataflow. To insert new or changed data objects into the dataflow, the publish-method (see Code Listing 2) of the API can be called at the desired place in the pipeline. For instance, a gesture recognizer that has detected a pre-defined gesture will publish a new gesture object in the dataflow. These methods accept 1...n instances of data objects or a data container that consists of an array of data objects as well as a release timestamp. The interface “IData” ensures the compatibility of the published data objects with the generic data types defined in Squidy and specifies common methods and enumerations.

Code Listing 2: Methods provided by the Squidy Core to insert new or changed data objects into the dataflow. The data objects are propagated at the output pin of the node where the method is called.
Furthermore, the Squidy Interaction Library comes with diverse off-the-shelf filters for signal processing, data fusion, filtering and synchronization that provide the essential functionalities for developing multimodal interfaces. Compared to OIDE [Serrano et al. 2008] or SKEMMI [Lawson et al. 2009], Squidy incorporates the facility to add new filters (including properties, algorithms, logic, and descriptions) without the other environments’ need for switching to a different development environment. Therefore, the source code is embedded and can be manipulated by users directly. Changes made to the source code will be compiled and integrated on-the-fly and the new or changed functionality is thus instantly available to users (see 0 for more details, p. 134).
Each implementation of a filter owns a data queue and a processing thread without any effort on the part of the developer. The incoming data will be queued until the processing thread dequeues data to perform custom data processing automatically. Thus, the interaction library runs in a multi-threaded environment that allows concurrent data processing by each filter without blocking the complete process chain (e.g., a filter that is currently waiting for a system resource does not block other filters during that time). This system of self-contained filter components prevents side effects in signal processing and thus aids users in designing consistent and reliable interaction techniques.
Users can intercept a filter’s internal processing by implementing simple pre-defined method stubs similar to the concept of “Method Call Interception”. The following method stubs reflect different points of entry that differ in the quantity and type of dequeued data provided. The processing thread determines in a certain sequence whether a stub is implemented and then invokes this stub using reflection.

Code Listing 3: The “preProcess” stub grants access to all data of a data container before it is processed.
In the “preProcess” stub (see Code Listing 3), the collections of data types grouped within a data container are passed to the method’s implementation. This is an easy way to access all data at a glance or iterate through the data collection manually, e.g., to search for interaction patterns consisting of a diverse set of data types concerning multimodal interaction. Whenever it is sufficient to process one particular data instance at a time, the “process” method stub is appropriate. The code fragment in Code Listing 4 is a generic representation of such a process method stub.

Code Listing 4: Processing of an individual data object of the specified type.
In the case of the “process'” stub (see Code Listing 4), the Squidy Core iterates through the collection automatically. It therefore does not have to be done programmatically as in the “preProcess” stub. Here, DATA_TYPE is a placeholder for a generic data type (see section 5.2.1.1, p. 122) offering a simple data-type filter for the dataflow. The Squidy Core only passes instances of this specified generic type to the method implementation.
Before the data collection is published to the next filter of the processing chain (connected visually on the output pin of the corresponding node) or bridged back to any device or application, the data collection can be accessed through the “postProcess” stub (see Code Listing 5). An example of using this post processing is the functionality of removing duplicate data from the dataflow to reduce data-processing overhead.

Code Listing 5: All data objects of a data container are accessible through the “postProcess” stub after they have been individually processed in the “process” method.
The Squidy Core uses the Java Reflection mechanism to determine if a filter has implemented such a data interception and passes requested data to the implementation automatically. Therefore, no additional effort is required for interface declaration, generation and compilation such as is needed for CIDL[51] used by the OpenInterface framework. This flexibility of the Squidy Core to quickly integrate or modify filter techniques is essential for the rapid and iterative prototyping of interactive interfaces.
To sum up, the Squidy Interaction Library provides a very flexible software framework based on three key concepts: generic data types, Squidy Bridges, and the Squidy Core. Heterogeneous devices and toolkits can be easily tied to the Squidy Interaction Library using the Squidy Bridges (OSC Bridge, Native Interface Bridge) as common interfaces for data transmission and the generic data types as the common data structure are made available. The Squidy Core provides a multi-threaded environment for performing concurrent data processing that improves data throughput and minimizes lag. The Squidy Core API supports developers in quickly implementing new filters or changing existing filters without the need for recompilation or repackaging.
Currently we run applications based on Microsoft .Net, Windows Presentation Foundation and Surface SDK, Adobe Flash and Flex, OpenGL for C++ or JOGL as well as standard Java technology. The Squidy Core itself is written in Java and thus provides platform independency. The Squidy Bridges combined with Squidy Client reference implementations provide various external and integrated drivers and toolkits. Currently, Squidy supports the NUIGroup Touchlib, the Apple iPhone SDK, the Android SDK as well as Microsoft Surface SDK for multi-touch interaction, the ART DTrack and the NaturalPoint OptiTrack for finger gestures [Foehrenbach et al. 2009] and body-tracking, the libGaze for mobile eye-tracking [Herholz et al. 2008], the iPaper framework for pen and paper-based interaction [Signer & Norrie 2007], the Phidgets API for physical prototyping and self-developed components for laser pointer interaction [König, Bieg, Schmidt, et al. 2007], GPU-accelerated low-latency multi-touch tracking (SquidyVision), the Nintendo Wii Remote and tangible user interface (TUI) interaction.
5.2.2 User Interface Concept
The Squidy framework architecture provides a high degree of flexibility and it offers a great variety of powerful functionalities either directly integrated in Squidy or connected through Squidy Bridges. However, interaction designers have mostly very limited experience in software engineering and programming, since they often share an interdisciplinary background in the field of design, psychology and human-computer interaction. Moreover, the technical details of fine-grained textual programming and the complexity of common development environments such as Microsoft Visual Studio or Eclipse IDE may also overwhelm even more experienced users and constrain their creativity and development process. We therefore provide a novel visual design environment[52] for the Squidy Interaction Library in which we combine visual dataflow programming approaches with zoomable user interface concepts [König et al. 2009c]. We thereby hide technical complexity by bundling cohesive functionalities in ready-to-use nodes that can be visually arranged in a directed graph in order to define the dataflow. The nodes can be moved, connected, duplicated, and deleted via direct manipulation [Shneiderman 1983]. We thereby lower the threshold [Myers et al. 2000] for using the Squidy user interface as compared to the conventional textual programming environments. In contrast to other visual dataflow programming environments (see section 5.1, p. 112), we address scalability issues [Johnston et al. 2004] as well as the common trade-off between the functionality of a system and the difficulty of its usage [Myers et al. 2000] by utilizing the concept of zoomable user interfaces. Nodes reveal more detailed information and advanced operations by semantic zooming [Perlin & Fox 1993] following the paradigm of object-oriented user interfaces [Collins 1994]. Thus, the Squidy user interface is designed to offer both a low threshold as well as a high degree of sophistication and flexibility – or ceiling of use as defined by Myers et al. [2000] as a major goal for user interface software tools. In order to assess if we actually achieved this goal we conducted a formative evaluation study which we will discuss in section 5.2.3 (p. 137). In the following subsections we present the most relevant features of the Squidy user interface.

Figure 59: Annotated screenshot of the Squidy user interface showing an example pipeline for laser pointer interaction (see Figure 55, p. 120, for the same screenshot without annotations).
5.2.2.1 Knowledge Base
Squidy provides a wide range of ready-to-use devices and filter nodes stored in a knowledge base that is accessible within the Squidy user interface. An assortment is directly offered at the bottom of the pipeline view separated by their type (see Figure 59). The selection and arrangement of the nodes are based on statistics of previous usage as well as expert heuristics and thus give suggestions for suitable partners for the currently focused device or filter. This dynamic suggestion may lead to increased efficiency and also helps novice users to limit the otherwise overwhelming number of available nodes to a relevant subset. The user can directly drag an appropriate node from the selection (bottom) to the design space for the pipeline (centre). If the desired node is not part of the suggested subset, the user has the possibility of accessing all nodes in the knowledge base by zooming into the corresponding view at the bottom. Therein, dynamic queries support the exploration (see Figure 60). These are based both on automatically generated metadata about each node as well as user-generated tags.

Figure 60: The Squidy Knowledge Base lists all available nodes which can be filtered dynamically with a keyword search based on automatically generated metadata and user-generated tags.
5.2.2.2 Semantic Zooming
In accordance with the assumption that navigation in information spaces is best supported by tapping into our natural spatial and geographic ways of thinking [Perlin & Fox 1993], we use a zoomable user interface concept to navigate within the Squidy design environment. When zooming into a node, additional information and corresponding functionalities appear, depending on the screen space available (semantic zooming). Thus, the user is able to gradually define the level of detail (complexity) according to the current need for information and functionality. In order to guide the user, we provide a goal-directed zooming technique that automatically zooms to the elevation at which the object of interest (specified by a double-click on the desired object) appears in appropriate detail [Woodruff et al. 1998]. The square grid on the background of the design space is used to improve the perceived sketching affordance of the design environment [Norman 1999], but it is also a visual landmark that supports users’ navigation and orientation within the zoomable interface [Gerken 2006]. Furthermore, the smooth animation between each zoom level [Bederson & Boltman 1999] in combination with the breadcrumb navigation located at the header of each view helps users build a mental map of the information and user interface structure. Thanks to semantic zooming, users are also able to organize pipelines hierarchically which provides the ability to realize even very large and complex projects. However, the complexity is not directly visible to the user, since it is hidden in the hierarchical arrangement of the pipelines, thereby keeping the user interface manageable.
5.2.2.3 Interactive Configuration & Evaluation
In contrast to other related systems, the user does not have to leave the visual interface and switch to additional applications and programming environments in order to get additional information, to change properties, or to generate, change or access the source code of device drivers and filters. In Squidy, zooming into a node reveals all parameters and enables the user to interactively adjust the values at run-time (see Figure 61). The changes take place immediately without any need for a restart, providing a direct relationship between user interaction and application feedback and thereby, as Card et al. puts it, maintaining causality, [Card et al. 1983]. This is especially beneficial for empirically testing a number of different parameters (e.g., adjusting the noise levels of a Kalman filter) because of the possibility of directly comparing these settings without introducing any (e.g. temporal) side effects. This process of interactive configuration and evaluation is essential during the design of multimodal interaction, especially when using uncommon interaction techniques and user interfaces. Squidy therefore facilitates fast development iterations in these contexts.

Figure 61: View of a zoomed Kalman filter node with table of parameters. Parameter changes are applied immediately. Spatial scrolling with overview window (right) is provided visually. Via goal-directed zooming, the user can access further information about the node (Figure 62) and the filter source code (Figure 63).
5.2.2.4 Details on demand
Going beyond the access and manipulation of parameters, Squidy provides illustrated information about the functionality, usage and context of a node, and this information is directly embedded in the node. By zooming into the information view marked by a white “i” on a blue background (see Figure 61), the information is shown without losing the context of the node as a whole. This information view (see Figure 62) may contain code documentation (e.g., automatically generated by javadoc), user-generated content (e.g., from online resources such as wikipedia.org or the Squidy-Wiki) or specifically assembled documentation such as a product specification consisting of textual descriptions, images or videos. In contrast to the OpenInterface repository[53] an interaction designer using Squidy does not need to open a web browser and search for the corresponding component in an online repository in order to obtain the relevant information. Due to the semantic zooming concept the user specifies the level and type of information need implicitly by navigating in the zoomable user interface and spatially filtering the information space.

Figure 62: Information view of the Kalman filter node providing illustrated descriptions about its functionality, its node type as well as the processed data types on the input and output pin.
5.2.2.5 Embedded Code and on-the-fly compilation
The user even has the ability to access the source code (see Figure 63) of the node by semantic zooming. Thus, code changes can be made directly inside the design environment. Assistive utilities such as syntax highlighting or code completion support the user further. If the user zooms out, the code will be compiled and integrated on-the-fly, again without needing to restart the system. Users may also generate new input and output devices or filters by adding an empty node and augmenting it with applicable code. In order to minimize the usage threshold in the first steps and to reduce the writing/programming effort, the empty node already contains all relevant API method definitions for data handling and processing. Therefore, only the desired algorithm has to be filled into a suitable method’s body in the node. By zooming out the new node is compiled and is then immediately ready for use. The design rationale is not to replace classical development environments such as Microsoft Visual Studio or Eclipse IDE, but rather to integrate some of their functionality directly into Squidy. Thereby, we provide a unified environment that seamlessly integrates the most relevant tools and functionalities for the visual design and interactive development of multimodal interfaces.

Figure 63: Source Code of the corresponding device or filter node is directly accessible by semantic zooming. Zooming-out leads to runtime compilation of the source code and live integration into the current pipeline.
5.2.2.6 Dataflow Visualization - Visual Debugging
The visual design of an interaction technique requires a profound understanding of the dataflow as well as the semantics of the designed pipeline. For instance, to detect and analyze interaction patterns such as gestures or multimodal input, researchers or interaction designers should be able to quickly get an overview of the interaction dataflow during a particular time span. In keeping with the pipe-and-filter metaphor, we integrate a dataflow visualization at the centre of each pipe (see Figure 59, p. 130). This simple yet powerful view (see Figure 64 and Figure 65) visualizes the data flow through its corresponding pipe with respect to its temporal and spatial attributes. At a glance, users are able to inspect a massive amount of data, including data occurring in parallel, according to its spatial location and chronological order [Rädle et al. 2009].

Figure 64: Dataflow visualization based on a scatter plot showing the values of all forwarded data objects of a pipe within a defined time span.

Figure 65: The Thermo Plot visualization (early prototype without axis labels) shows the two-dimensional movement over time (the colour of older values is less intensive). In this example, the user has performed a circular gesture.
Every node in Squidy operates strictly within its own thread and this therefore provides multi-threading and concurrent data processing without any additional effort. This allows a higher bandwidth and enhances data throughput. Nevertheless, users may produce errors while implementing nodes or use incorrect parameter settings. This can cause side effects (e.g., array index out of bounds failure) that consequently may lead to an inaccurate interaction technique or a local error (other nodes run in separate threads and are therefore unaffected). Thus, the design environment supplies each project, pipeline, node and pipe (in the following we call these shapes) with a visual colour-coded outer-glow effect (see Figure 59, p. 130) that represents the node's current status. Three distinct colours (green, red, grey) are uniquely mapped to a class of conditions. A green glowing shape indicates a properly operating node implementation running underneath. Additionally, pipes possess a green illumination when interaction data is flowing or has recently been flowing through them. The red glow indicates that an error has occurred during execution of the node’s implementation (e.g., unhandled exception - NullPointerException). Then, all connected outgoing pipes to a defective pipeline or node are given the same error colour-coding status to enhance error detection and allow faster, more efficient error correction. Shapes that are not set as activated (not running) and pipes that currently do not have interaction data flowing through them exhibit grey illumination. Thereby, without any need for interaction, the user can perceive the status of the data flow between the nodes of the pipeline.
In order to debug the dataflow of a particular data type, a data type filter is provided at the beginning as well as at the end of each pipe (see Figure 66). The coloured arrows give an overview of the currently filtered data type categories – each arrow representing an entire subgraph based on the primitive virtual devices of Wallace [Wallace 1976]. Zooming into the data type filter reveals its user interface that shows the Squidy hierarchy of generic data types discussed in section 5.2.1.1 (p. 122). By deactivating (clicking on) an individual data type, the transmission of data objects of the deactivated data type can be suppressed at this place in the pipe at runtime. If a particular data type should be visualized but not transferred to the next node, the data type filter underlying the dataflow visualization can be used for deactivation. Thus, the user can visually debug the interaction data but nevertheless prevent it from being forwarded to connected nodes downstream. The combination of selective filtering, interactive visualization and status representation by colour-coded pipes and nodes provides great potential for debugging and iterative development. In contrast to conventional development environments such as Microsoft Visual Studio and Eclipse IDE, the integrated debugging capabilities in Squidy supersede a separated debugging mode that would require extensive logging and higher runtime performance. Thus, interaction data can be investigated at runtime without negatively affecting actual interaction. (e.g., while conducting a user test).

Figure 66: Overview of the data type filter represented by colour-coded arrows (left) and the zoomed filter user interface (right). Clicking on the data types activates and deactivates the filter at runtime. Deactivated filters are white – if the entire sub graph is deactivated the corresponding arrow disappears in the overview (e.g., blue arrow representing DataString and DataToken).
5.2.3 Formative Evaluation Study
We conducted a formative study to identify usability issues of the current user interface and framework design and to stimulate further design iterations. The study was arranged as a 7-hour workshop which enabled us to compensate for learning effects and also to investigate advanced tasks with higher ecological validity. In addition to the evaluation, a further goal of the workshop was to introduce the Squidy Interaction Library to a broader user group. We combined three data gathering techniques: interviews, questionnaires, and observations. Thus, we could not only identify usability issues, but we were also able to discuss problems, their supposed reasons, and potential solutions with the participants. By gradually increasing task difficulty we aimed at identifying “walls”. Walls are considered barriers “where the user must stop and learn many new concepts and techniques to make further progress”, [Myers et al. 2000]. Since interaction designers’ technical background is usually less extensive than programmers’, we assumed that potential walls will limit creativity and productivity of the former. Moreover, we wanted to find out how well visual dataflow programming supports users. Obviously, compared to textual programming, it poses not only a lower threshold for use but also a lower ceiling. Textual programming has the inverse relationship. Hence, we needed to find out how well users could cope with the transition from visual to textual programming.
Since Squidy primarily addresses interaction designers, we selected ten participants who had direct connections to human-computer interaction. All of them had coarse prior knowledge of the interaction library’s scope but no detailed experience. Thus, Squidy’s concept and functional range needed little explanation. We formed five teams of two participants each, allowing team members to cooperate and interact more dynamically. Moreover, the inner-team communication was treated as “thinking aloud” and provided valuable information through our observations.
We constructed four main tasks covering our basic task types. Each task was divided into distinct subtasks, enabling a more precise instructive formulation and reducing the overall complexity. Participants were free to choose between visual or textual programming wherever applicable.
The first task (T1) consisted of two subtasks that could be solved solely by visual dataflow programming, addressing the visual assembly. Our goal was to determine how users could make use of visual dataflow programming.
· T1.1: Participants were to send their local mouse position to an application running on a remote machine.
· T1.2: After completion we changed the mouse behaviour on the remote machine, resulting in a vertically inverted movement. Participants had to discover and correct this manipulated behaviour.
The second task (T2) raised task complexity and required textual programming for the first time by addressing node development. Hence, we could investigate comprehension of the non-visual dataflow programming whose conceptual model differs considerably from object-oriented programming. Since Squidy’s text editor does not support code completion yet, participants could use the Eclipse IDE in parallel. Eclipse allows hot deployment at runtime (no restart of Squidy required).
· T2.1: Participants should remotely control a Microsoft PowerPoint presentation via the Apple iPhone. Each team was provided with an iPhone running the Squidy Client that sent finger positions and inertia data over the network. Additionally, the iPhone app was capable of interpreting short contacts (taps) as clicks. Participants were to remotely control the mouse pointer and skip forward through the presentation’s slides via the iPhone.
· T2.2: Participants were to switch the presentation’s arrow to pen mode by tapping iPhone’s screen with two fingers, allowing to draw on the slides. Another two-finger tap should switch back to the arrow mode.
· T2.3: Shaking the iPhone was to be interpreted as a “delete drawings” action.
We implemented the third task (T3) as a transfer task, which was much like T2, hence again addressing node development. The transfer of the afore gained knowledge and the reusability of implemented nodes was of primary interest. Therefore we replaced the iPhone with a Microsoft Surface.
· T3.1: Teams were asked to modify their pipeline from T2.1 and T2.2 to enable controlling the mouse pointer on a remote machine running a PowerPoint presentation via the Surface. Again, a two-finger contact should switch between arrow and pen mode.
· T3.2: Since the Surface implementation did not emulate mouse clicks natively, this functionality was to be implemented, permitting to skip forward through the slides.
· T3.3: Deletion of drawings was to be achieved by putting a physical object, which has been augmented by Microsoft’s Surface byte tags (token), on the Surface.
The fourth task (T4) addressed framework development. These tasks needed advanced knowledge of the framework architecture and higher level programming skills. Interaction designers are normally not concerned about framework development which is more the concern of experienced programmers. However, these tasks enabled us to assess the achieved level of understanding – if the participants were able to accomplish these tasks and how much help they needed.
· T4.1: Participants were to start and stop a pipeline via a Phidgets hardware button.
· T4.2: The pipeline’s current frames-per-second rate was to be displayed on a Phidgets Text-LCD.
· T4.3: Finally, participants should visualize the status of a pipeline via two coloured LEDs.
Participants received a one-hour technical introduction before the tasks. Based on a within-subjects design, all teams ran through all tasks. All participants rated each subtask’s difficulty on a 5-point scale before and after completion. The pre-task rating allowed us to assess the expectations of our users and the post-task rating enabled us to assess how Squidy lived up to user expectations. They also filled out a questionnaire after each main-task, rating the perceived assistance from Squidy, the concept of semantic zooming and the general fun factor on a 5-point scale (see Appendix E, p. 169, for more details). Additionally, we recorded task completion times for each subtask. Thus, the dependent variables were difficulty, assistance, concept of semantic zooming, fun and completion time. Four teams carried out the tasks in a main observation room. Support was provided by the observing test monitor and three experts, allowing us to get feedback. Teams who had finished their task were taken to another room where a group interview was held. Additionally, we randomly selected each team once to complete one task in our usability laboratory. Again, support was provided by the attendant expert. Sessions were video and audio recorded. We also conducted an interview subsequent to the task.
5.2.3.1 Results
Overall, the data gained from questionnaires, observations and the measured task completion times showed that participants understood the visual dataflow programming concept very well. On average, T1 was solved in 19.6 minutes (SD 12.26, 1 outlier of 41 minutes). Participants rated the support given by Squidy on the 5-point-scale very positively with 4.67 on average (SD 0.5), the appreciation for the concept of semantic zooming with 4.33 on average (SD 0.866) and the fun factor with a mean of 4.0 (SD 0.707) very positively. No team had problems in employing visual dataflow programming, confirming a low threshold for use. T2.2 revealed a huge drop in all user ratings (see Figure 67 and Figure 68) and caused an almost 2.5-times increase (to the next-longest) in mean task completion time (T1 19.6 min, T2 149.2 min, T3 31.2 min, T4 61.6 min). All participants reported problems handling multi-touch input from the iPhone. Without further explanation from the experts participants were unable to detect if single- or two-finger gestures were applied, inter alia resulting in the overall lowest fun rating (mean 2.9, SD 1.370) as well as the most observed frustration. Moreover, participants reported difficulty as being higher in the post-rating than in the pre-rating, a unique occurrence for the visual assembly and node development task types. This let us identify a wall. It arose on the switch from visual to textual dataflow programming. After the transfer task it became obvious that participants – once having “climbed the wall” – could well apply what they had learned in T2. Subjective ratings went back to a remarkably positive level (see Figure 67 and Figure 68) while task completion times decreased.
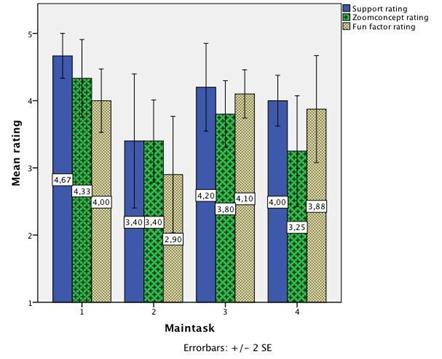
Figure 67: Mean ratings for support, concept of semantic zooming, and fun factor. 1 = very bad; 5 = very good.

Figure 68: Mean difficulty rating for each subtask (before and after attendance). 1 = very easy; 5 = very difficult.
Four participants (ID1, ID2, ID7, and ID8) commented that it would beneficial to have the possibility to display the dataflow visualization in parallel with the code view and the properties view. We observed that the dataflow visualization was often used to get an initial understanding of the interaction data as well as to verify the applied modifications throughout the entire iterative development process. Basically, this confirms the high value of the dataflow visualization provided by Squidy, but it also shows a limitation of the current user interface concept. In order to minimize navigation complexity, we limited the zoomable user interface concept to a single focus view that switches the entire viewport while zooming. The participants zoomed therefore from the code view or properties view to the dataflow visualization and back for each development step. A solution for improving the development efficiency could be to enable multi focus concepts such as introduced by Schweizer [2009]. Here, the views can be split inside the application window. However, the multi-focus concept would break with the analogy relating zoomable user interfaces and users’ physical navigation in real world. That may reduce the naturalness of the navigation and could also lead to a higher degree of user interface complexity. Another option is to keep the Squidy user interface concept, but to provide the possibility of opening additional application windows of the same Squidy instance in parallel. Thus, the navigation inside the Squidy zoomable user interface remains natural, but the user can utilize the already learned window-management of the operating system to arrange multiple views. We have implemented the latter alternative and plan to further investigate this issue in upcoming formative evaluation studies.
A further comment raised by three participants (ID4, ID9, and ID10) is related to the type of nodes. We utilize pipe-and-filter metaphor for visual dataflow programming (see section 5.2, p. 120 for more details). This metaphor differentiates between source nodes (data input), filter nodes (data processing), and sink nodes (data output). We applied this differentiation of the nodes in the suggestion dock of the knowledge base (at the bottom of a pipeline view, see Figure 59, p. 130), but not to those in the zoomable knowledge base where all nodes are listed side by side (see Figure 60, p. 131). The participants suggested grouping the different node types consistently in the knowledge base and further emphasizing the differentiation by their visual appearance (e.g., different node shapes or colours). These comments showed that the participants understood the pipe-and-filter metaphor and their suggestions are valuable. However, most input devices also provide output modalities (e.g., tactile or visual feedback of the laser pointer) – an essential question which arises in this context is whether a node representing a device (e.g., the laser pointer) should unify sink and source (combines input and output functionality in one node) or if it should be separated as two independent input and output nodes. This decision would also have an impact on the design of the pipelines. If the input and output nodes are separate, the pipelines originate from source nodes and end at a sink node (e.g., could be arranged in a line shape). However, the same device (e.g., laser pointer) is represented twice, which could confuse the user and increases the number of nodes in a pipeline (less scalable for larger projects). If the input and output functionality is joined in one node representing the device, a pipeline with feedback has to be defined as a cycle – originating from the device node, flowing through appropriate filters and ending in the device node. This could also confuse users experienced with conventional pipe-and-filter concepts. So far, we have used the latter concept in which a device is represented by a single node joining input and output in favour of minimizing the visual complexity of the user interface. The separated version can be integrated in Squidy as an alternative concept with less effort. Based on the findings of this study a comparative evaluation study of both concepts would be valuable.
Overall, the results from our formative study have shown that the applied concepts were supportive, easy to understand and well-received, providing fast and straightforward solutions. A very interesting result was found in the transition from visual to textual programming, depicting a wall where users had to exert a remarkably high learning effort. These findings, as well as the valuable comments and feedback from the participants, are good entry points for further research and more focused investigations. In addition to these experimental results we also evaluated the Squidy Interaction Library “in the wild” by using it in real world projects. We describe them in the following section.
5.2.4 Example Use Cases
Over the last two years, we iteratively developed, used and enhanced the Squidy Interaction Library while applying it in several diverse projects. The starting point was the need for an infrastructure that facilitates the design and the evaluation of novel input devices and interaction techniques in multimodal and ubiquitous environments. We identified this need while developing a particular input device – the interactive laser pointer (already discussed in section 3.3, p. 59). In order to implement the laser pointer technique, we developed the Squidy framework architecture and user interface as supporting infrastructure. Thus, the development of Squidy has always been driven by actual needs and based on practical, day-to-day experiences.
Squidy improved the design and research process of the laser pointer by providing the opportunity to interactively implement, change and empirically test diverse parameter settings and smoothing techniques without introducing side effects. In an iterative approach the dataflow was visualized, the filter logic was adapted, the filter parameters were optimized, and the resulting interaction technique was finally evaluated based on a Fitts' Law Tapping Test (ISO 9241-9, see Figure 69, left).
The Adaptive Pointing technique was also completely developed, optimized and evaluated with Squidy (described in section 4.2, p. 96). Besides the advantages of interactive development, a major benefit for the scientific work was the ability to switch conditions in the conducted comparative evaluation study without biasing the experimental results. The test administrator started or stopped only the adaptive pointing node – no restart of the application, no parameter or driver changes, and no rerouting or any other modifications was required which could have introduced undesired influences. Thus, Squidy supported the entire development lifecycle, and provided very efficient project progress.


Figure 69: Squidy laser pointer interaction in front of the large, high-resolution Powerwall at the University of Konstanz (left) and within the 360° panoramic screen at the ZKM | Karlsruhe (right).
In a follow-up project we specifically benefited from the flexibility of the framework architecture and the independency of the components in Squidy, since we could easily apply the developed laser pointer to the artistic installation “Globorama” (see section 0, p. 87). This scenario also utilized the laser pointer for interaction but came with a very different display and visualization technique (see Figure 69, right). Instead of the 221-inch, high-resolution Powerwall (planar rear-projection), the laser pointer was applied to a 360° front-projection display (vertically and horizontally curved due to projection foil) with a diameter of 8 m and a resolution of 8192 x 928 pixels (six projectors with soft edge blending). Moreover, the application differed greatly from the original: The panoramic projection of high-resolution geographic maps was based on the complex logarithm [Böttger et al. 2008] and rendered with customized OpenGL software called ZKM Panorama Display Software[54]. Although the display as well as the application changed, the Squidy nodes for laser pointer interaction and corresponding smoothing and interaction techniques could be used without modifications thanks to the standardization of the interfaces (Squidy Bridges) and the framework abstraction (Squidy Core). The laser pointer hardware device, the optical tracking system (SquidyVision), and the Squidy Interaction Library in general proved to be robust and usable over the course of two artistic and industrial exhibitions: Globorama was exhibited from 29th September to 21st October 2007 at the ZKM | Center for Art and Media Karlsruhe as first installation of the ZKM PanoramaFestival[55] (about 5,000 visitors). In 2008, Globorama was exhibited from 16th to 25th May at the ThyssenKrupp Ideenpark[56] at the Trade Fair Centre in Stuttgart (about 290,000 visitors). Furthermore, the laser pointer interaction was applied to commercial Eyevis rear-projection cubes[57] and presented at several events. Here, the tracking cameras were integrated inside the housing of the cubes and the Squidy Interaction Library was used to provide interaction techniques enabling users to control legacy applications with the laser pointer on a single cube or seamlessly over multiple joined cubes.
As an alternative to our laser pointer device, we embedded an infrared laser diode in a conventional gyration mouse[58] designed originally for relative pointing in mid-air (based on the combination of a gyroscope and an accelerometer). Thereby, we could achieve the best of both worlds: the Laser-Mouse provides the naturalness of absolute pointing in mid-air with the high precision, well-known relative pointing at the desk. The Laser-Mouse acts just as a normal wireless mouse when it is placed on a desk. When it is lifted up and pointed at the display, the optical tracking system of the Squidy Interaction Library recognizes the laser reflection and adjusts the virtual pointer accordingly (see Figure 70). The Adaptive Pointing technique can be seamlessly applied to the Laser-Mouse, improving the pointing performance as needed.
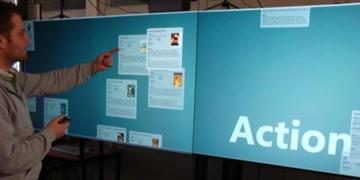
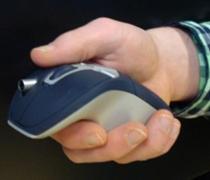
Figure 70: A user controls the MedioVis 2.0 visual seeking system [Heilig et al. 2009a] on two Eyevis Cubes with our Laser-Mouse (left). The Laser-Mouse is a combination of a conventional Gyration mouse (augmented with an infra-red laser diode) with the Squidy optical tracking system (right).
Squidy was also used to design functional prototype systems for personal information management with interactive television sets [Jetter et al. 2008]. For this application domain, the Nintendo Wii, in its role as a standard input device for home entertainment, was integrated into Squidy. Although the device, the application, and the display were completely different from the previous projects (see Figure 71, left), the smoothing filters implemented for the laser pointer could be applied to the Wii and proved to be very beneficial, since both the Nintendo Wii and the laser pointer share an important similarity in being absolute pointing devices. Furthermore, the wiigee gesture recognition toolkit [Schlömer et al. 2008] was integrated into Squidy to enable three-dimensional gestures with the Nintendo Wii. Although the toolkit was originally designed for the Nintendo Wii, the laser pointer can be used interchangeably thanks to the generalization of the interaction data based on the generic data types defined in Squidy. This flexibility enabled the investigation of suitable laser pointer gestures facilitating electronic mind mapping on LHRDs. In the course of a masters thesis in psychology, the Squidy Interaction Library, including the laser pointer and the wiigee gesture recognition toolkit, were used as the basis of a formal evaluation study comparing different gesture sets for mind mapping sessions on the Powerwall of the University of Konstanz [Stasche 2008].
In the context of Surface Computing, we conceptually and technically combined multiple touch-sensitive displays with the aim of providing a more ubiquitous user experience based on the naturalness and directness of touch interaction [Jetter et al. 2009]. In this scenario, we integrated mobile handhelds (see Figure 71, right) as personal devices as well as shared multi-touch tables and large, high-resolution walls (2 x 67’’ eyevis HD-Cubes) for collaborative design and visual information organization. This hardware setting was also used in the course of the research project MedioVis in order to develop a functional prototype of a next generation knowledge media workbench [Heilig et al. 2009b]. Here, Squidy offered the possibility for incorporating multiple input and output devices and it enabled the visual as well as physical design of novel interaction techniques [König 2008].


Figure 71: Prototype for a personal information management system with interactive television sets – Squidy supports the utilization of the Nintendo Wii (left). Multi-touch remote control for a LHRD with an Apple iPhone using the Squidy Client (right).
In order to facilitate multimodal input and context-aware applications, mobile eye-tracking [Herholz et al. 2008] and freehand gestures [Foehrenbach et al. 2009] were integrated (see Figure 72, left). To further close the gap between the digital and the physical world, we enhanced this environment with digital pens for interactive sketching (see Figure 72, right) and the possibility of interacting with physical tokens on the diverse multi-touch displays [Klinkhammer & Reiterer 2008] (see Figure 73).
![eye-tracker-IMG_1055 [1280x768].JPG](KoenigDissertation2010-Dateien/image141.jpg)

Figure 72: Simultaneous multimodal interaction for LHRDs based on mobile eye-tracking in combination with hand and finger gestures [Bieg 2009] (left). Squidy integrates the iPaper framework [Signer & Norrie 2007] enabling scribbling and hand-writing with digital pens on specific paper or projection surfaces (augmented with Anoto[59] dot pattern).


Figure 73: Multi-touch surfaces augmented with physical tokens used in the context of blended museum [Klinkhammer 2009] (left) and for interactive portfolio presentation of the ICT AG, Kohlberg[60] (right).
The Squidy optical tracking system, called SquidyVision, has been improved over the course of several projects starting with laser pointer tracking with diverse displays (Powerwall, ZKM PanoramaScreen, Eyevis Cubes) and devices (several laser pointer versions and Laser-Mouse) through multi-touch tracking on custom-built or commercial tables . Currently it supports GPU-accelerated, low-latency tracking [Schmidt 2008] with a single camera or with multiple cameras connected to a single computer or to distributed computers, each running one or several instances of SquidyVision. The SquidyVision instances stream the interaction data over the network to the Squidy Design Environment which processes the data and applies interaction techniques. Thus, SquidyVision scales very well with increasing size and resolution of displays. SquidyVision is one of the most utilized components of the Squidy Interaction Library. It is used in various, diverse research projects within the Human-Computer Interaction Group at the University of Konstanz including MedioVis[61] (e.g., Figure 70), permaedia[62] (e.g., Figure 71), Blended Museum[63] (e.g., Figure 73), Blended Interaction Design[64] (e.g., Figure 74), and inteHRDis[65] (the project within which Squidy was developed). For example, a collaborative system for creative activities was developed with Squidy components and exhibited at the Creativity World Forum 2009 in Ludwigsburg (see Figure 74).


Figure 74: Creativity enhancing collaborative system based on multi-touch table, token interaction, digital pens, and peripheral wall display. The system was used as a moderation and presentation environment (left) and as a collaborative work environment (right) in the course of the workshop Creativity Think Tank[66] at the Creativity World Forum 2009 in Ludwigsburg. The multi-touch table and the token interaction were driven by the Squidy Interaction Library.


Figure 75: Research prototype illustrating the military help-desk workplace of the future – a multi-user and multi-display environment with multi-touch and token interaction. This prototype was developed as part of a close cooperation between EADS Defence & Security, Friedrichshafen, and the Human-Computer Interaction Group at the University of Konstanz. It was exhibited at the Symposium "Heereslogistik der Zukunft" organized by the German Army in Aachen, December 2009.
Furthermore, as part of a collaboration project between EADS Defence & Security, Friedrichshafen, and the Human-Computer Interaction Group at the University of Konstanz, a research prototype for a collaborative help-desk environment for military logistics and interactive support was developed (see Figure 75). Here, the Squidy Interaction Library was combined with the geographic information system ArcGis[67] enabling the exploration of high-resolution geographic maps with multi-touch and token interaction.
The Squidy Interaction Library is also used in commercial contexts. The University of Konstanz licensed the Squidy Interaction Library including SquidyVision to ICT AG, Kohlberg, which developed in cooperation with the Human-Computer Interaction Group a professional multi-touch table specially designed to fulfil the sophisticated requirements for use in industrial and artistic exhibitions, trade fairs, events and museums. The ICT Multitouch Table is a commercial product utilizing the Squidy Interaction Library. In contrast to the projects thus far mentioned, before in which experienced members of the Human-Computer Interaction Group were using and developing with Squidy, here professional (interaction) designers and event staff are working with the system. They have different tasks, requirements, and contexts of use as well as different experiences. However, the Squidy user interface concept as well as the software and hardware techniques proved themselves to be suitable for professional applications in several exhibitions. For example, the ICT Multitouch Table was utilized at the ZF Friedrichshafen AG[68] booth at the International Motor Show IAA 2009 in Frankfurt (see Figure 76) and at the Robert Bosch GmbH[69] booth at the International Radio Exhibition IFA 2009 in Berlin. For the latter exhibition four Multitouch Tables were combined, providing altogether a 120 inch multi-touch surface. At the Siemens Medical Solutions[70] booth at the RSNA[71] 2009 in Chicago seven ICT Multitouch Tables were used to realize a sophisticated multitouch moderation system. A moderator informed visitors about the new Siemens medical imaging products on a multitouch moderation desk. Visitors could follow the presentation which was duplicated on a large peripheral display or could explore the product features on their own at six visitor multitouch tables. The presentation system was realized by the ICT AG based on the Squidy Interaction Library (pictures of the booth are not released to public).


Figure 76: Commercial usage of the Squidy Interaction Library with SquidyVision driving the ICT Multitouch Table: Interactive Gear Configurator at the ZF Friedrichshafen AG booth at the IAA 2009 in Frankfurt (left). The ICT Multitouch Table with token interaction was presented at the ISE 2010 in Amsterdam (right).
The Squidy Interaction Library is also used for student projects, for example in the course of the lecture “Interaction design for high-resolution displays” in the winter term 08/09. Here, students were asked to augment real-world physical objects with digital functionalities (see Figure 77). For example, they developed an intelligent key box that displays temperature and humidity and reminds the key owner to take the bike light along when it is dark outside (see Figure 77, left). Another project was an intelligent flower bucket that presents information about the current light, temperature and humidity status and helps to keep the flower alive (see Figure 77, right). The students used Phidgets sensors and controllers [Greenberg & Fitchett 2001] which were integrated into the Squidy Interaction Library. This enabled us to verify whether Squidy is indeed flexible enough enough to support such very uncommon ideas and concepts.
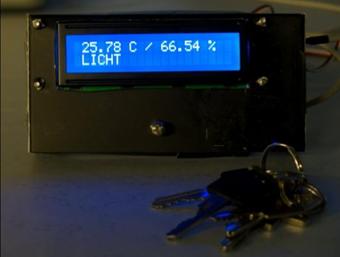

Figure 77: Student projects in the course “Interaction design for high-resolution displays” utilizing Phidgets and the Squidy Interaction Library. Intelligent key box (left) and flower bucket (right).
Almost all of the already mentioned input devices and interaction techniques are available in our interaction laboratory known as the Media Room at the University of Konstanz (see Figure 78). The Media Room provides a research environment for the design, development, and evaluation of novel interaction techniques and input devices as well as a simulation facility for future collaborative work environments. It offers various input (e.g., laser pointer, hand-gestures, Laser-Mouse, multi-touch, eye-gaze) and output devices (multi-touch tables, HD-Cubes, 4K LCD, audio & tactile feedback) which can be used simultaneously and in various combinations, creating a new dimension of multi-modal interaction [König et al. 2009d]. The Squidy Interaction Library is the common development and evaluation infrastructure of the Media Room supporting hardware and software interaction design.

Figure 78: The Media Room is a lab environment which provides a variety of input and output devices with different modalities and form factors. Squidy serves as the basic technology for integrating these different devices as well as for configuring and evaluating them. http://hci.uni-konstanz.de/mediaroom
5.3 Summary
"Creating interactive systems is not simply the activity of translating a pre-existing specification into code; there is significant value in the epistemic experience of exploring alternatives", [Hartmann et al. 2007].
This statement is especially true for the design of multimodal user interfaces, since there is no well established body of knowledge and no ready-to-use solution for multimodal user interfaces that the designer can take advantage of. Interaction designers need to physically explore and prototype new interaction modalities and therefore require development environments that especially support the interactivity and the dynamic of this creative development process. We presented the Squidy Interaction Library which supports the interactive design of multimodal user interfaces threefold. First, it provides a software architecture that offers the flexibility needed for rapid prototyping and the ability to integrate a vast variety of heterogeneous input devices and signal processing filters. Second, the Squidy visual user interface introduces a new user interface concept that combines visual dataflow programming with semantic zooming in order to reduce visual and technical complexity. This visual approach also enables a high degree of interactivity that is further supported by the fluid integration of code views, filter mechanisms and visualization tools. Third, the Squidy Interaction Library not only focuses on rapid prototyping, but also provides advanced development techniques and tool-support for empirical evaluation of the developed interfaces.

Figure 79: This feature cloud shows how Squidy contributes to the development lifecycle of multimodal interaction techniques. Each phase in the lifecycle, whether it is the design and prototyping, the implementation and testing, or the usability evaluation phase is surrounded by a variety of Squidy features that support the interaction designer or developer during this activity.
Figure 79 shows a high-level feature cloud of the Squidy Interaction Library with respect to the different development phases. The appropriateness of Squidy to the actual design and research process was practically shown by the illustrated scientific and commercial use cases. These real-world experiences were complemented by a formative evaluation study which we conducted in order to identify usability issues of the current user interface and framework design. Overall, the results have shown that the applied concepts were supportive, easy to understand and well-received, providing fast and straightforward solutions. Through questionnaires and interviews, several valuable user comments could be gathered that will aid in the further development of Squidy. In addition to the current single focus navigation, multi focus navigation or an alternative multi window solution might be beneficial for users when comparing different nodes as well as for investigating the data flow while adjusting filter parameters. A further raised issue was related to the type specific arrangement and representation of nodes. The participants suggested distinguishing clearly between input, filter, and output nodes. Furthermore a relatively high learning effort was observed for the textual dataflow programming style (in contrast to the low threshold for visual dataflow programming). The observations and interviews revealed that participants were not familiar with textual dataflow programming and they had to learn the conceptual model underlying it. In order to reduce this barrier to entry, the source code view in Squidy could be augmented with visual development tools, adaptive code suggestion and inspection functionalities. These findings and the participants’ comments are good entry points for further research and iterative development.
6 Conclusion
Large, high-resolution displays provide great advantages compared to conventional desktop displays such as the capability to visualize large amounts of data simultaneously as well as the potential for co-located collaborative work. Conventional input devices such as mouse and keyboard, however, restrict users in their ability to move freely in front of these LHRDs. This mobility is an essential requirement since users are not able to perceive every pixel from a single position due to the large dimensions and high resolutions of typical LHRDs. We therefore investigated input devices and interaction techniques that are suitable for supporting users in interacting with large, high-resolution displays (first research question formulated in section 1.1, p. 15).
In order to systematically design and evaluate a suitable input device we identified the design space of input devices in general and described them in a new design space classification (see section 3.2, p. 41). Existing input device taxonomies were integrated and complemented with so far unconsidered dimensions such as mobility, hardware design, output modality as well as multi-device and multi-user support. This theoretical groundwork supports the informed design, the systematic description, and the methodical evaluation of input devices in general. Based on this classification, we iteratively explored diverse design variants of the interactive laser pointer introduced in section 3.3 (p. 59). The interactive laser pointer enables users to interact more naturally as compared to the indirect mouse thanks to the absolute pointing mode. Moreover, the camera-based tracking of the laser point reflection on the display surface provides great flexibility for moving around while interacting. The hardware input device and the optical tracking are driven by a laser pointer interaction toolkit which we developed especially to fulfil the challenging requirements of laser pointer interaction with LHRDs in terms of robustness, scalability, responsiveness, speed, accuracy, and flexibility. In order to assess the general feasibility of the laser pointer interaction for LHRDs, an experiment on the basis of the ISO standard 9241-9 was conducted comparing the interactive laser pointer with the current standard input device, the mouse. The results revealed that the laser pointer‘s performance in terms of selection speed and precision was close to that of the mouse (around 89 % at a distance of 3 m) although the laser pointer was handled freely in mid-air without a stabilizing rest.
We identified the natural hand tremor and the human motor precision as limiting factors for more precise pointing. Because the human capabilities restricted better performance, a further improvement of the tracking system would not directly provide better results. We therefore investigated precision enhancing pointing techniques to overcome these restrictions. Based on a review, we categorized existing solutions into velocity-oriented, target-oriented, and manual-switching approaches. However, these techniques introduce unnatural pointer behaviour, need semantic knowledge of the environment, or put additional cognitive as well as physical load on the user in choosing the mode of interaction. We therefore introduce Adaptive Pointing, a novel interaction technique which addresses the common problem of accuracy when using absolute pointing devices for distant interaction (see section 4.2, p. 96). The basic idea is to improve pointing performance for absolute input devices by implicitly adapting the CD gain to the current user’s needs without violating the users’ mental model of absolute-device operation. Users expect a 1:1 mapping between their device movement in motor space and the resulting pointer movement in display space when using an absolute pointing device. Adaptive Pointing appears to provide this pure absolute behaviour but imperceptibly lowers the CD gain when higher precision is needed. To evaluate the Adaptive Pointing technique we conducted a controlled experiment with 24 participants comparing Adaptive Pointing with absolute pointing using the interactive laser pointer. The results showed that Adaptive Pointing results in a significant improvement compared with absolute pointing in terms of movement time (19%), error rate (63%), and user satisfaction.
The interactive laser pointer in combination with the Adaptive Pointing technique gives therefore one answer to the research question raised at the beginning of this thesis. We conclude that they are suitable for supporting users in interacting with large, high-resolution displays. From a technical perspective, they are designed to scale well with increasing display size and resolution, to provide maximum flexibility for physical navigation, and to support multi-device interaction. From a user’s perspective, the absolute pointing of the interactive laser pointer offers a very natural and direct mode of interaction. Moreover, the Adaptive Pointing technique enables very precise pointing from distant positions even when interacting in mid-air. The positive user feedback received within the experiments as well as through the exhibitions of the artistic installation Globorama, in which the interactive laser pointer was used by several hundred users, underlines the suitability of our solution. Although the developed software and hardware solutions, the theoretical design space classification, and the interaction technique Adaptive Pointing were developed and evaluated with respect to LHRDs, the contributions of this thesis are also applicable to less challenging display environments and to other pointing devices (also underlined by the fact that the University of Konstanz has filed the Adaptive Pointing technique for a European patent).
During the design of the interactive laser pointer we identified a lack of a suitable development environment for the design of input devices and interaction techniques in general. Conventional development environments such as Microsoft Visual Studio fail to support uncommon interaction modalities nor do these support appropriate data processing techniques (e.g., for computer vision), not to mention the handling of multipoint and multi-user applications (e.g., for multi-touch interaction). We therefore investigated the following research question in order to support our own development and to provide a tool set, as well as the gained knowledge, to the community: How can we support the design and evaluation of novel input devices and interaction techniques for large, high-resolution displays (research question 2)?
A common problem when designing input devices is the heterogeneity of programming languages, data protocols, device drivers, and special-purpose toolkits which impede their utilization and assembly for realizing the desired functionality. In section 5.2 (p. 120) we presented a software architecture that enables their unification in a common interaction library providing a single, well-defined interface for their utilization. In addition to using this software framework within an existing development environment supporting textual programming, we further provide a visual design environment based on visual dataflow management and the concept of zoomable user interfaces. This visual user interface hides the complexity of the technical implementation from the user by providing a simple visual language and a collection of ready-to-use devices, filters and interaction techniques. This facilitates rapid prototyping and fast iterations for the design and development of novel input devices and interaction techniques. However, if more functionality and profound customizations are required, the visual user interface reveals more detailed information and advanced operations on demand by using the concept of semantic zooming. Thus, users are able to adjust the complexity of the visual user interface to their current needs and knowledge. Both the software framework and the visual designer make up the main parts of the Squidy Interaction Library, which is a major contribution of this thesis and our answer to the second research question. Moreover, the interactive laser pointer with all data processing filters, computer vision algorithms, and the multi-model Kalman Filter as well as the Adaptive Pointing technique are components included in and accessible by the Squidy Interaction Library (more than 95.000 lines of code altogether). Therefore, not only does Squidy unify various toolkits; it also joins the contributions of this thesis in terms of hard- and software solutions.
We investigated the usability of the Squidy Interaction Library within a formative study as well as “in the wild” within various scientific, artistic, and commercial projects. Although there are ideas for improvement (see section 5.2.3.1, p. 140), Squidy has already become an essential and valuable software infrastructure for conducting research on novel input devices and interaction techniques at the Human-Computer Interaction Group of the University of Konstanz. It is also an integral part of the commercial Multitouch Table of the ICT AG, Kohlberg, and has been used worldwide in industrial and scientific exhibitions. Since October 2009, the Squidy Interaction Library has been free software and published under the GNU Lesser General Public License.

Figure 80: Illustration of the multifarious contributions described within this thesis. All software and hardware solutions are unified in the Squidy Interaction Library. The thesis therefore introduces a particular input device and interaction technique especially designed for interacting with large, high-resolution displays, but it also provides a development environment for designing, improving and evaluating them.
Appendix
See PDF Version for the complete Appendix: http://www.wekoenig.de/KoenigDissertation2010.pdf
List of Figures
Figure 16: Classification of the design space of input devices and corresponding usability measures.
Figure 33: Unidirectional Tapping Task with width W and amplitude A based on ISO standard 9241-9.
Figure 34: Mean effective throughput of the interactive laser pointer (blue) and the mouse (orange).
Figure 40: Flow-chart of the Adaptive Pointing algorithm.
Figure 43: Comparing error rates for different target widths (bubble test).
Figure 45: Comparing movement times for different target widths (bubble test).
Bibliography
Ahlborn, B.A., Thompson, D., Staadt, O.G., Kreylos, O. & Hamann, B., 2005. A practical system for laser pointer interaction on large displays. In VRST '05: Proceedings of the ACM symposium on Virtual reality software and technology. New York, NY, USA: ACM, pp. 106-109.
Apitz, G. & Guimbretière, F., 2004. CrossY: a crossing-based drawing application. In UIST '04: Proceedings of the 17th annual ACM symposium on User interface software and technology. New York, New York, USA: ACM, pp. 3-12.
Balakrishnan, R. & MacKenzie, I.S., 1997. Performance differences in the fingers, wrist, and forearm in computer input control. In CHI '97: Proceedings of the SIGCHI conference on Human factors in computing systems. New York, NY, USA: ACM, pp. 303-310.
Balakrishnan, R., 2004. "Beating" Fitts' law: virtual enhancements for pointing facilitation. International Journal of Human-Computer Studies, 61, 857-874.
Ball, R., North, C. & Bowman, D.A., 2007. Move to improve: promoting physical navigation to increase user performance with large displays. In CHI '07: Proceedings of the SIGCHI conference on Human factors in computing systems. New York, NY, USA: ACM, pp. 191-200.
Ballagas, R., Memon, F., Reiners, R. & Borchers, J., 2007. iStuff mobile: rapidly prototyping new mobile phone interfaces for ubiquitous computing. In CHI '07: Proceedings of the SIGCHI conference on Human factors in computing systems. New York, NY, USA: ACM, pp. 1107-1116.
Ballagas, R., Ringel, M., Stone, M. & Borchers, J., 2003. iStuff: a physical user interface toolkit for ubiquitous computing environments. In CHI '03: Proceedings of the SIGCHI conference on Human factors in computing systems. New York, NY, USA: ACM, pp. 537-544.
Ballagas, R., Rohs, M. & Sheridan, J.G., 2005. Sweep and point and shoot: phonecam-based interactions for large public displays. In CHI '05: Extended abstracts on Human factors in computing systems. New York, NY, USA: ACM, pp. 1200-1203.
Baudisch, P., Cutrell, E., Hinckley, K. & Eversole, A., 2005. Snap-and-go: helping users align objects without the modality of traditional snapping. In CHI '05: Proceedings of the SIGCHI conference on Human factors in computing systems. New York, NY, USA: ACM, p. 301–310.
Baudisch, P., Cutrell, E., Robbins, D., Czerwinski, M., Tandler, P., Bederson, B. & Zierlinger, A., 2003. Drag-and-pop and drag-and-pick: Techniques for accessing remote screen content on touch- and pen-operated systems. In INTERACT 2003: Proceedings of the 6th IFIP International Conference on Human-Computer Interaction. pp. 57-64.
Bederson, B.B. & Boltman, A., 1999. Does Animation Help Users Build Mental Maps of Spatial Information? In INFOVIS '99: Proceedings of the 1999 IEEE Symposium on Information Visualization. Washington, DC, USA: IEEE Computer Society.
Benoit, A., Lawson, J.L., Bonnaud, L., Caplier, A., Jourde, F., Nigay, L., Serrano, M., Damousis, I. & Tzovaras, D., 2007. Multimodal signal processing and interaction for a driving simulator: Component-based architecture. Journal on Multimodal User Interfaces, 1(1), 49-58.
Bieg, H., 2009. Gaze-augmented manual interaction. In CHI EA '09: Proceedings of the 27th international conference extended abstracts on Human factors in computing systems. New York, NY, USA: ACM, pp. 3121-3124.
Bieg, H., 2008. Laserpointer and eye gaze interaction - design and evaluation, Master thesis, University of Konstanz.
Blanch, R., Guiard, Y. & Beaudouin-Lafon, M., 2004. Semantic pointing: improving target acquisition with control-display ratio adaptation. In CHI '04: Proceedings of the SIGCHI conference on Human factors in computing systems. New York, NY, USA: ACM, pp. 519-526.
Bouchet, J. & Nigay, L., 2004. ICARE: A Component-Based Approach for the Design and Development of Multimodal Interfaces. In CHI '04: Extended abstracts on Human factors in computing systems. New York, NY, USA: ACM, pp. 1325-1328.
Bouchet, J., Nigay, L. & Ganille, T., 2004. ICARE software components for rapidly developing multimodal interfaces. In ICMI '04: Proceedings of the 6th international conference on Multimodal interfaces. New York, NY, USA: ACM, pp. 251-258.
Buxton, W., Fitzmaurice, G., Balakrishnan, R. & Kurtenbach, G., 2000. Large Displays in Automotive Design. IEEE Computer Graphics and Applications, 20(4), 68-75.
Buxton, W., 1983. Lexical and pragmatic considerations of input structures. ACM SIGGRAPH Computer Graphics, 17(1), 31-37.
Böttger, J., Preiser, M., Balzer, M. & Deussen, O., 2008. Detail-In-Context Visualization for Satellite Imagery. Computer Graphics Forum, 27(2), 587-596.
Böttger, J., 2009. Complex-Logarithmic Views and Map Warping: Distortion-Oriented Detail-in-Context Methods with special consideration of anisotropic compression, University of Konstanz.
Card, S.K., Mackinlay, J.D. & Robertson, G.G., 1991. A morphological analysis of the design space of input devices. ACM Transactions on Information Systems, 9(2), 99-122.
Card, S.K., Newell, A. & Moran, T.P., 1983. The Psychology of Human-Computer Interaction, Hillsdale, NJ, USA: L. Erlbaum Associates Inc.
Casiez, G., Vogel, D., Balakrishnan, R. & Cockburn, A., 2008. The impact of control-display gain on user performance in pointing tasks. Human-Computer Interaction, 23(3), 215-250.
Cavens, D., Vogt, F., Fels, S. & Meitner, M., 2002. Interacting with the big screen: pointers to ponder. In CHI '02: Extended abstracts on Human factors in computing systems. New York, NY, USA: ACM, pp. 678-679.
Chen, X. & Davis, J., 2001. LumiPoint: Multi-User Laser-Based Interaction on Large Tiled Displays.
Cockburn, A. & Firth, A., 2003. Improving the acquisition of small targets. In BCS-HCI'03: Proceedings of the 17th British CHI Group Annual Conference on Human-Computer Interaction. p. 181–196.
Collins, D., 1994. Designing Object-Oriented User Interfaces, 1st edition, Redwood City, CA, USA: Benjamin-Cummings Publishing Co., Inc.
Douglas, S.A., Kirkpatrick, A.E. & MacKenzie, I.S., 1999. Testing pointing device performance and user assessment with the ISO 9241, Part 9 standard. In CHI '99: Proceedings of the SIGCHI conference on Human factors in computing systems. New York, NY, USA: ACM, pp. 215-222.
Fitts, P.M. & Peterson, J.R., 1964. Information capacity of discrete motor responses. Journal of Experimental Psychology, 67(2), 103-112.
Fitts, P.M., 1954. The information capacity of the human motor system in controlling the amplitude of movement. Journal of Experimental Psychology, 47(6), 381-391.
Foehrenbach, S., König, W.A., Gerken, J. & Reiterer, H., 2009. Tactile feedback enhanced hand gesture interaction at large, high-resolution displays. Journal of Visual Languages & Computing, 20(5), 341-351.
Foley, J.D., Wallace, V.L. & Chan, P., 1984. The human factors of computer graphics interaction techniques. IEEE Computer Graphics and Applications, 4(11), 13-48.
Forlines, C., Vogel, D. & Balakrishnan, R., 2006. HybridPointing: fluid switching between absolute and relative pointing with a direct input device. In UIST '06: Proceedings of the 19th annual ACM symposium on User interface software and technology. New York, NY, USA: ACM, pp. 211-220.
Frees, S., Kessler, G.D. & Kay, E., 2007. PRISM interaction for enhancing control in immersive virtual environments. ACM Transactions on Computer-Human Interaction, 14(1), 1-31.
Frolov, P., Matveyev, S., Göbel, M. & Klimenko, S., 2002. Using kalman filter for natural hand tremor smoothing during the interaction with the projection screen. In Workshop Proceedings VEonPC’2002. pp. 94-101.
Gellersen, H., Kortuem, G., Schmidt, A. & Beigl, M., 2004. Physical Prototyping with Smart-Its. IEEE Pervasive Computing, 3(3), 74-82.
Gerken, J., 2006. Orientierung und Navigation in zoombaren Benutzerschnittstellen unter besonderer Berücksichtigung kognitions-psychologischer Erkenntnisse, Master thesis, University of Konstanz.
Gibbs, C., 1962. Controller design: Interactions of controlling limbs, time-lags and gains in positional and velocity systems. Ergonomics, 5, 385-402.
Gray, P., Ramsay, A. & Serrano, M., 2007. A Demonstration of the OpenInterface Interaction Development Environment. In UIST '07 - Adjunct Proceedings of the 20th annual ACM Symposium on User Interface Software and Technology (Demo Session). New York, NY, USA: ACM.
Greenberg, S. & Fitchett, C., 2001. Phidgets: easy development of physical interfaces through physical widgets. In UIST '01: Proceedings of the 14th annual ACM symposium on User interface software and technology. New York, NY, USA: ACM, pp. 209-218.
Grossman, T., Hinckley, K., Baudisch, P., Agrawala, M. & Balakrishnan, R., 2006. Hover widgets: using the tracking state to extend the capabilities of pen-operated devices. In CHI '06: Proceedings of the SIGCHI conference on Human Factors in computing systems. New York, New York, USA: ACM, pp. 861-870.
Harper, R., Rodden, T., Rogers, Y. & Sellen, A., 2008. Being Human: Human-Computer Interaction in the year 2020, Cambridge, England: Microsoft Research Ltd.
Hartmann, B., Abdulla, L., Mittal, M. & Klemmer, S.R., 2007. Authoring sensor-based interactions by demonstration with direct manipulation and pattern recognition. In CHI '07: Proceedings of the SIGCHI conference on Human factors in computing systems. New York, NY, USA: ACM, pp. 145-154.
Heilig, M., Demarmels, M., Rexhausen, S., Huber, S. & Runge, O., 2009. Search, Explore and Navigate - Designing a Next Generation Knowledge Media Workbench. In SIDeR'09: Proceedings of the fifth Student Interaction Design Research Conference. Eindhoven, the Netherlands, pp. 40-43.
Herholz, S., Chuang, L., Tanner, T., Bülthoff, H. & Flemming, R.W., 2008. Libgaze: Real-time gaze-tracking of freely moving observers for wall-sized displays. In VMV '08: Proceedings of the 13th International Workshop on Vision, Modeling, and Visualization. Amsterdam, Netherlands: IOS Press, pp. 101-110.
Hinckley, K., Baudisch, P., Ramos, G. & Guimbretiere, F., 2005. Design and analysis of delimiters for selection-action pen gesture phrases in scriboli. In CHI '05: Proceedings of the SIGCHI conference on Human factors in computing systems. New York, New York, USA: ACM, pp. 451-460.
Hinckley, K., 2008. Input technologies and techniques. In A. Sears & J. A. Jacko Handbook of Human-Computer Interaction. Hillsdale, NJ, USA: L. Erlbaum Associates Inc., pp. 161-176.
Hudson, S.E., Worden, A., Walker, N. & Bharat, K., 1997. Making computers easier for older adults to use: area cursors and sticky icons. In CHI '97: Proceedings of the SIGCHI conference on Human factors in computing systems. New York, NY, USA: ACM, p. 266–271.
Jacob, R.J., 1996. The future of input devices. ACM Computing Surveys (CSUR), 28(4), 138-142.
Jetter, H., Engl, A., Schubert, S. & Reiterer, H., 2008. Zooming not Zapping: Demonstrating the ZOIL User Interface Paradigm for ITV Applications. In EuroITV'08: Adjunct Proceedings of European Interactive TV Conference.
Jetter, H., König, W.A. & Reiterer, H., 2009. Understanding and Designing Surface Computing with ZOIL and Squidy. In CHI 2009 Workshop - Multitouch and Surface Computing. Boston, USA.
Johnston, W.M., Hanna, J.R. & Millar, R.J., 2004. Advances in dataflow programming languages. ACM Computing Surveys (CSUR), 36(1), 1-34.
Kalman, R.E., 1960. A New Approach to Linear Filtering and Prediction Problems. Transactions of the ASME - Journal of Basic Engineering, 82(D), 35-45.
Kaltenbrunner, M., Bovermann, T., Bencina, R. & Costanza, E., 2005. TUIO - A Protocol for Table Based Tangible User Interfaces. In In Proceedings of the 6th International Workshop on Gesture in Human-Computer Interaction and Simulation. Vannes, France.
Kirsh, D. & Maglio, P., 1994. On distinguishing epistemic from pragmatic action. Cognitive Science, 18(4), 513-549.
Kirstein, C. & Mueller, H., 1998. Interaction with a Projection Screen Using a Camera-tracked Laser Pointer. In MMM '98: Proceedings of the Conference on MultiMedia Modeling. Washington, DC, USA: IEEE Computer Society, p. 191.
Klinkhammer, D. & Reiterer, H., 2008. Blended Museum - Perspektiven für eine vielfältige Besuchererfahrung. ICOM - Zeitschrift für interaktive und kooperative Medien, 7(2), 4-10.
Klinkhammer, D., 2009. Blended Museum - Steigerung von Besuchererfahrungen durch Interaktions- und Informationsdesign, Master thesis, University of Konstanz.
König, W.A., Bieg, H. & Reiterer, H., 2007. Laserpointer-Interaktion für große, hochauflösende Displays. In Mensch & Computer 2007: Interaktion im Plural, 7. Konferenz für interaktive und kooperative Medien. Weimar: Oldenbourg Verlag, pp. 69-78.
König, W.A., Bieg, H., Schmidt, T. & Reiterer, H., 2007. Position-independent interaction for large high-resolution displays. In IHCI'07: Proceedings of IADIS International Conference on Interfaces and Human Computer Interaction. Lisbon, Portugal: IADIS Press, pp. 117-125.
König, W.A., Böttger, J., Völzow, N. & Reiterer, H., 2008. Laserpointer-Interaction between art and science. In IUI'08: Proceedings of the 13th international conference on Intelligent user interfaces. New York: ACM Press, pp. 423-424.
König, W.A., Gerken, J., Dierdorf, S. & Reiterer, H., 2009. Adaptive Pointing – Design and Evaluation of a Precision Enhancing Technique for Absolute Pointing Devices. In INTERACT 2009: Proceedings of the 12th IFIP International Conference on Human-Computer Interaction. Berlin, Germany: Springer LNCS, pp. 658-671.
König, W.A., Gerken, J., Dierdorf, S. & Reiterer, H., 2009. Adaptive Pointing – Implicit Gain Adaptation for Absolute Pointing Devices. In CHI '09: Proceedings of the 27th international conference extended abstracts on Human factors in computing systems. New York, NY, USA: ACM, pp. 4171-4176.
König, W.A., Rädle, R. & Reiterer, H., 2010. Interactive Design of Multimodal User Interfaces - Reducing technical and visual complexity. Journal on Multimodal User Interfaces, 3(3), 197-212.
König, W.A., Rädle, R. & Reiterer, H., 2009. Squidy: A Zoomable Design Environment for Natural User Interfaces. In CHI '09: Proceedings of the 27th international conference extended abstracts on Human factors in computing systems. New York, NY, USA: ACM, pp. 4561-4566.
König, W.A., Rädle, R. & Reiterer, H., 2009. Visual Design of Multimodal Interaction - Bridging the Gap between Interaction Designers and Developers. In Workshop on the Challenges of Engineering Multimodal Interaction: Methods, Tools, Evaluation. Sankt Augustin / Bonn, Germany.
König, W.A., 2008. Visual and Physical Interaction Design for Information Services. In Invited Talk at the international conference on Human-Computer Interaction and Information Services. Prague, Czech Republic.
Lawson, J.L., Al-Akkad, A., Vanderdonckt, J. & Macq, B., 2009. An open source workbench for prototyping multimodal interactions based on off-the-shelf heterogeneous components. In EICS '09: Proceedings of the 1st ACM SIGCHI symposium on Engineering interactive computing systems. New York, NY, USA: ACM, pp. 245-254.
MacKenzie, I.S. & Jusoh, S., 2001. An Evaluation of Two Input Devices for Remote Pointing. In EHCI '01: Proceedings of the 8th IFIP International Conference on Engineering for Human-Computer Interaction. London, UK: Springer-Verlag, pp. 235-250.
MacKenzie, I.S. & Ware, C., 1993. Lag as a determinant of human performance in interactive systems. In CHI '93: Proceedings of the INTERACT '93 and CHI '93 conference on Human factors in computing systems. New York, NY, USA: ACM, pp. 488-493.
MacKenzie, I.S., 1991. Fitts' law as a performance model in human-computer interaction, Toronto, Ont., Canada: University of Toronto.
MacKenzie, I.S., 1995. Input Devices and Interaction Techniques for Advanced Computing. In W. Barfield & T. A. Furness Virtual environments and advanced interface design. New York, NY, USA: Oxford University Press, Inc., pp. 437-470.
McGuffin, M. & Balakrishnan, R., 2002. Acquisition of expanding targets. In CHI '02: Proceedings of the SIGCHI conference on Human factors in computing systems. New York, NY, USA: ACM, pp. 57-64.
Meyer, D.E., Abrams, R.A., Kornblum, S., Wright, C.E. & Smith, K.J., 1988. Optimality in human motor performance: Ideal control of rapid aimed movements. Psychological Review, 95(3), 340-370.
Microsoft Corporation, 2002. Pointer Ballistics for Windows XP. Viewed 09.05.2010. Available at: http://www.microsoft.com/whdc/archive/pointer-bal.mspx.
Myers, B.A., Bhatnagar, R., Nichols, J., Peck, C.H., Kong, D., Miller, R. & Long, A.C., 2002. Interacting at a distance: measuring the performance of laser pointers and other devices. In CHI '02: Proceedings of the SIGCHI conference on Human factors in computing systems. New York, NY, USA: ACM, pp. 33-40.
Myers, B.A., Hudson, S.E. & Pausch, R., 2000. Past, present, and future of user interface software tools. ACM Transactions on Computer-Human Interaction (TOCHI), 7(1), 3-28.
Ni, T., Bowman, D.A. & Chen, J., 2006. Increased display size and resolution improve task performance in Information-Rich Virtual Environments. In GI '06: Proceedings of the 32nd Graphics Interface Conference. Toronto, Ont., Canada, Canada: Canadian Information Processing Society, pp. 139-146.
Norman, D.A., 1999. Affordance, conventions, and design. Interactions, 6(3), 38-43.
Oh, J. & Stuerzlinger, W., 2002. Laser pointers as collaborative pointing devices. GI '02: Proceedings of the 28th Graphics Interface Conference, 141-149.
Olsen, D.R. & Nielsen, T., 2001. Laser pointer interaction. In CHI '01: Proceedings of the SIGCHI conference on Human factors in computing systems. New York, NY, USA: ACM, pp. 17-22.
Oviatt, S., 2008. Multimodal Interfaces. In A. Sears & J. A. Jacko Handbook of Human-Computer Interaction. Hillsdale, NJ, USA: L. Erlbaum Associates Inc., pp. 413-432.
Parys, R. & Knittel, G., 2009. Giga-Voxel Rendering from Compressed Data on a Display Wall. In WSCG '09: Proceedings International Conferences in Central Europe on Computer Graphics, Visualization and Computer Vision.
Peck, C.H., 2001. Useful parameters for the design of laser pointer interaction techniques. In CHI '01: Extended abstracts on Human factors in computing systems. New York, NY, USA: ACM, pp. 461-462.
Perlin, K. & Fox, D., 1993. Pad: an alternative approach to the computer interface. In SIGGRAPH '93: Proceedings of the 20th annual conference on Computer graphics and interactive techniques. New York, NY, USA: ACM, pp. 57-64.
Rexhausen, S. & Gerken, J., 2006. Laser-Pointer-Interaktion vor einem hochauflösenden, großen Bildschirm, Term paper, University of Konstanz.
Rädle, R., König, W.A. & Reiterer, H., 2009. Temporal-Spatial Visualization of Interaction Data for Visual Debugging. In EuroVis'09: Eurographics/IEEE Symposium on Visualization (Poster Session). Berlin, Germany.
Schlömer, T., Poppinga, B., Henze, N. & Boll, S., 2008. Gesture recognition with a Wii controller. In TEI '08: Proceedings of the 2nd international conference on Tangible and embedded interaction. New York, NY, USA: ACM, pp. 11-14.
Schmidt, T., 2008. Interaction Concepts for Multi-Touch User Interfaces: Design and Implementation, Bachelor thesis, University of Konstanz.
Schweizer, J., 2009. Gestaltung und Implementierung eines Multi-Fokus und Multi-Display Management-Systems,
Sears, A. & Shneiderman, B., 1991. High precision touchscreens: design strategies and comparisons with a mouse. International Journal of Man-Machine Studies, 34, 593-613.
Serrano, M., Nigay, L., Lawson, J.L., Ramsay, A., Murray-Smith, R. & Denef, S., 2008. The openinterface framework: a tool for multimodal interaction. In CHI '08: Extended abstracts on Human factors in computing systems. New York, NY, USA: ACM, pp. 3501-3506.
Shannon, C.E., 1949. Communication in the presence of noise. Proceeding of the Institute of Radio Engineers, 37(1), 10-21.
Shneiderman, B., 1983. Direct Manipulation: A Step Beyond Programming Languages. Computer, 16(8), 57-69.
Shupp, L., Ball, R., Yost, B., Booker, J. & North, C., 2006. Evaluation of viewport size and curvature of large, high-resolution displays. In GI '06: Proceedings of the 32nd Graphics Interface Conference. Toronto, Ont., Canada, Canada: Canadian Information Processing Society, pp. 123-130.
Signer, B. & Norrie, M.C., 2007. PaperPoint: a paper-based presentation and interactive paper prototyping tool. In TEI '07: Proceedings of the 1st international conference on Tangible and embedded interaction. New York, NY, USA: ACM, pp. 57-64.
Soukoreff, R.W. & MacKenzie, I.S., 2004. Towards a standard for pointing device evaluation, perspectives on 27 years of Fitts' law research in HCI. International Journal of Human-Computer Studies, 61, 751-789.
Stasche, A., 2008. Combining pointing and gestures: Novel interaction concepts for large high-resolution displays, Master thesis, University of Konstanz.
Sutter, C., Müsseler, J., Bardos, L., Ballagas, R. & Borchers, J., 2008. The impact of gain change on perceiving one's own actions. In M. Herczeg & M. C. Kindsmüller M&C '08: 8. fachübergreifende Konferenz für interaktive Medien - Viel Mehr Interaktion. München: Oldenbourg Verlag, pp. 147-156.
Taylor, R.M., Hudson, T.C., Seeger, A., Weber, H., Juliano, J. & Helser, A.T., 2001. VRPN: a device-independent, network-transparent VR peripheral system. In VRST '01: Proceedings of the ACM symposium on Virtual reality software and technology. New York, NY, USA: ACM, pp. 55-61.
Vaillancourt, D.E. & Newell, K.M., 2000. Amplitude changes in the 8–12, 20–25, and 40 Hz oscillations in finger tremor. Clinical Neurophysiology, 111(10), 1792-1801.
Vogel, D. & Balakrishnan, R., 2005. Distant freehand pointing and clicking on very large, high resolution displays. In UIST '05: Proceedings of the 18th annual ACM Symposium on User Interface Software and Technology. New York, NY, USA: ACM, pp. 33-42.
Wallace, V.L., 1976. The semantics of graphic input devices. ACM SIGPLAN Notices, 11(6), 61-65.
Ware, C., 2004. Information Visualization: Perception for Design 2 ed., San Francisco, CA, USA: Morgan Kaufmann Publishers Inc.
Wilson, A. & Pham, H., 2003. Pointing in intelligent environments with the worldcursor. In INTERACT 2003: Proceedings of the 6th IFIP International Conference on Human-Computer Interaction.
Woodruff, A., Landay, J. & Stonebraker, M., 1998. Goal-directed zoom. In CHI '98: CHI 98 conference summary on Human factors in computing systems. New York, NY, USA: ACM, pp. 305-306.